
Tax Policy – Sources of Government Revenue in the OECD
Key Findings
- In 2018, OECD countries raised one-third of their tax revenue through consumption taxes such as the Value-Added Tax (VAT), making consumption taxes on average the most important revenue source.
- Social insurance taxes and individual income taxes were the second and third most important sources of tax revenue in the OECD, respectively, at approximately 25 percent each, a change from 1990, when individual income taxes accounted for more revenue than social insurance taxes.
- On average, OECD countries collected little from the corporate income tax (9.5 percent) and the property tax (5.6 percent).
- When looking at both OECD and non-OECD countries by region, Asia, Africa, and South America rely more on consumption taxes and corporate income taxes and less on income and social insurance taxes compared to the OECD average.
- On average OECD and non-OECD countries in North America rely more on corporate income taxes and “other taxes” than the OECD average and less on social insurance and individual taxes.
- Oceania doesn’t rely at all on social insurance taxes, while consumption taxes are the region’s most important revenue source.
Introduction
Developed countries raise tax revenue through a mix of individual income taxes, corporate income taxes, social insurance taxes, taxes on goods and services, and property taxes. The mix of tax policies can influence how distortionary or neutral a tax system is. Taxes on income can create more economic harm than taxes on consumption and property. However, the extent to which an individual country relies on any of these taxes can differ substantially.
A country may decide to have a lower corporate income tax to attract investment, which may reduce its reliance on the corporate income tax revenue and increase its reliance on other taxes, such as social insurance taxes or consumption taxes. For example, in 2018, Lithuania raised only 5.1 percent of total revenue from corporate income taxes, but a combined 79.6 percent of total revenue came from social insurance taxes and consumption taxes.
Countries may also be situated near natural resources that allow them to rely heavily on taxes on related economic activity. Norway, for example, has a substantial oil production industry on which it levies a high (78 percent) income tax and thus raises a significant amount of corporate income tax revenue.[1]
These policy and economic differences among Organisation for Economic Co-operation and Development (OECD) countries have created differences in how they raise tax revenue.
Average OECD Revenue Sources
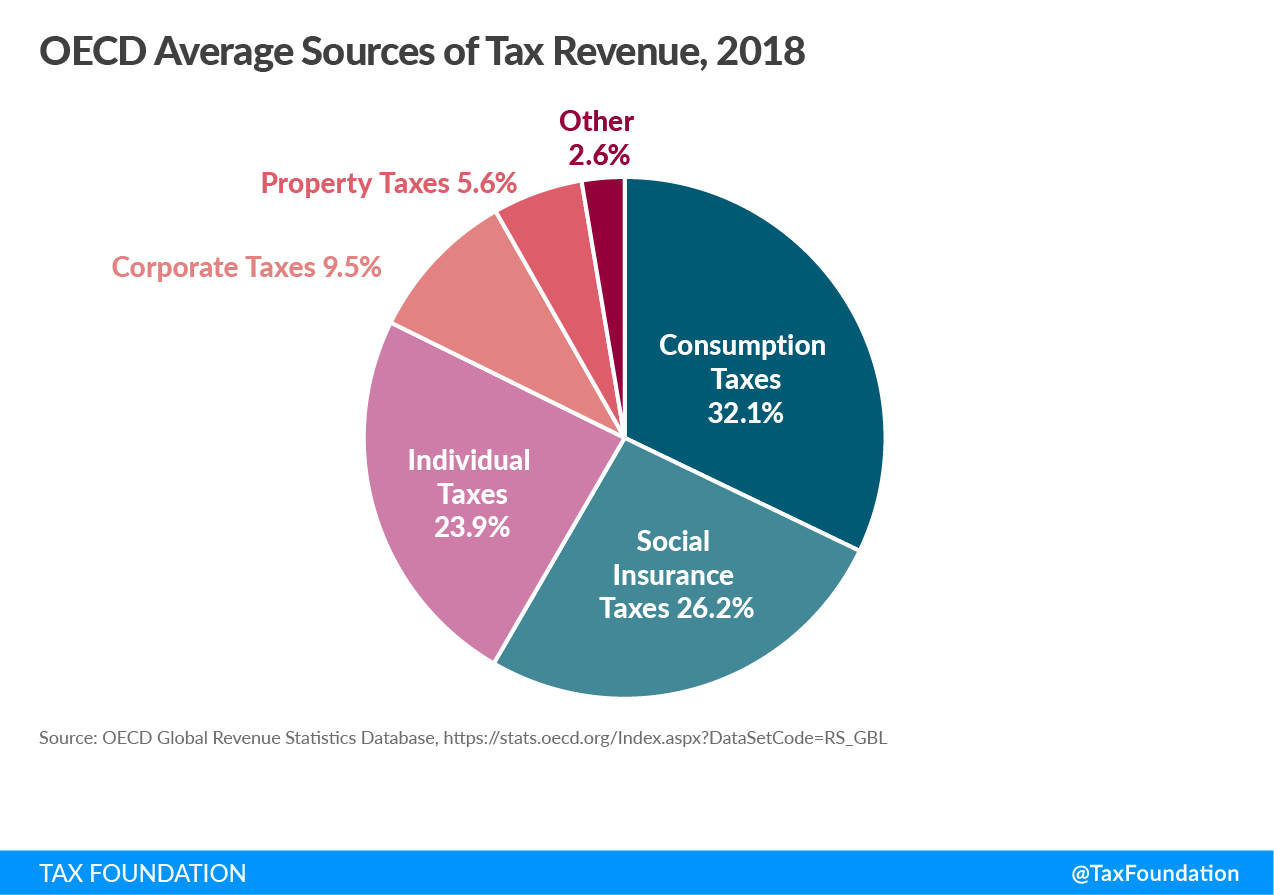
Per the most recent data from the OECD (2018),[2] consumption taxes were the largest source of tax revenue for OECD countries. On average,[3] countries raised 32.1 percent of their tax revenue from consumption taxes. This is unsurprising given that all OECD countries (except the United States) levy Value-Added Taxes (VAT) at relatively high rates.
The next significant source of tax revenue is social insurance taxes, which raise 26.2 percent of revenue on average. Individual income taxes accounted for 23.9 percent of total revenue across the OECD. The smallest shares of revenue were from corporate income taxes (9.5 percent) and property taxes (5.6 percent).
OECD Revenue Sources, 2018 Compared to 1990

When comparing average 2018 and 1990 OECD tax revenue sources, the most notable change is a decrease in individual income taxes versus increases in social insurance and consumption taxes. Revenues from corporate income taxes have also increased compared to 1990 (despite declining corporate income tax rates[4]). The relative importance of property taxes as a source of revenue has stayed roughly constant.
Sources of Tax Revenue
Consumption Taxes
Consumption taxes are taxes on goods and services. These are in the form of excise taxes, VAT, or retail sales taxes. Most OECD countries levy consumption taxes through VAT and excise taxes. The United States is the only country in the OECD with no VAT. Instead, most U.S. state governments and many local governments apply a retail sales tax on the final sale of products and excise taxes on the production of goods such as cigarettes and alcohol.[5]
In 2018, Chile relied the most on taxes on goods and services, raising approximately 53.3 percent of its total tax revenue from these taxes. Chile was followed by Latvia (44.5 percent) and Hungary (44 percent) (Table 1, below).
The United States raised the least amount of tax revenue in the OECD from consumption taxes, at 17.6 percent in 2018. Switzerland raised slightly more, at 20.8 percent, followed by Japan, at 21 percent.
Social Insurance Taxes
Social insurance taxes are typically levied in order to fund specific programs such as unemployment insurance, health insurance, and old age insurance. In most countries, these taxes are applied to both an individual’s wage and an employer’s payroll.
The Slovak and Czech Republic relied the most on social insurance taxes (both at 44.1 percent), followed by Lithuania (42.1 percent) and Slovenia (40 percent) (Table 1, below).
Denmark raised the least, at 0.1 percent, because social programs in Denmark are mostly funded from taxes other than dedicated social insurance taxes. Australia and New Zealand are the only countries that do not levy specific social insurance taxes on workers to fund government programs.
Individual Income Taxes
Income taxes are levied directly on an individual’s income, beginning with wage income. Many nations also levy their individual income tax on investment income such as capital gains, dividends, interest, and business income. These taxes are typically levied in a progressive manner, meaning that an individual’s average tax rate increases as income increases.
The country with the highest reliance on individual income taxes in 2018 was Denmark (54.4 percent), followed by the United States (40.7 percent) and Australia (40.3 percent) (Table 1, below).
Chile (6.7 percent), the Slovak Republic (10.8 percent), and the Czech Republic (12.2 percent) relied the least on individual income taxes.
Corporate Income Taxes
The corporate income tax is a direct tax on corporate profits. All OECD countries levy a tax on corporate profits. However, countries differ substantially in how they define taxable income and the rate at which they apply the tax. Generally, the corporate income tax raises little revenue compared to other sources.
Chile relied the most on its corporate income tax, at 22.1 percent of total tax revenue. Mexico (21.8 percent) and Australia (18.5 percent) also relied heavily on their corporate income tax compared to the OECD average of 9.5 percent (Table 1, below).
In 2018, Hungary (3.2 percent), Latvia (3.4 percent), and Italy (4.5 percent) relied the least on the corporate income tax.
Property Taxes
A much smaller source of tax revenue for most OECD countries is the property tax. The property tax is levied on the value of an individual’s or business’ property. Other types of property taxes include estate, gift, and inheritance taxes, and net wealth taxes.
The United Kingdom relied the most on property taxes in the OECD (12.3 percent), followed by the United States (12.2 percent) and Canada (11.7 percent) (Table 1, below).
Estonia relied the least on property taxes, raising only 0.7 percent of total revenue. Lithuania (1 percent), the Slovak Republic (1.2 percent) and Austria (1.3 percent) also relied very little on property taxes.
Revenue Sources of Selected Countries Compared to the OECD Average
The OECD averages described above reflect overall tendencies in revenue collections of developed countries. However, many OECD countries deviate from these averages quite substantially, reflecting social and economic differences across countries. The following country profiles illustrate different distributions of tax revenue sources.
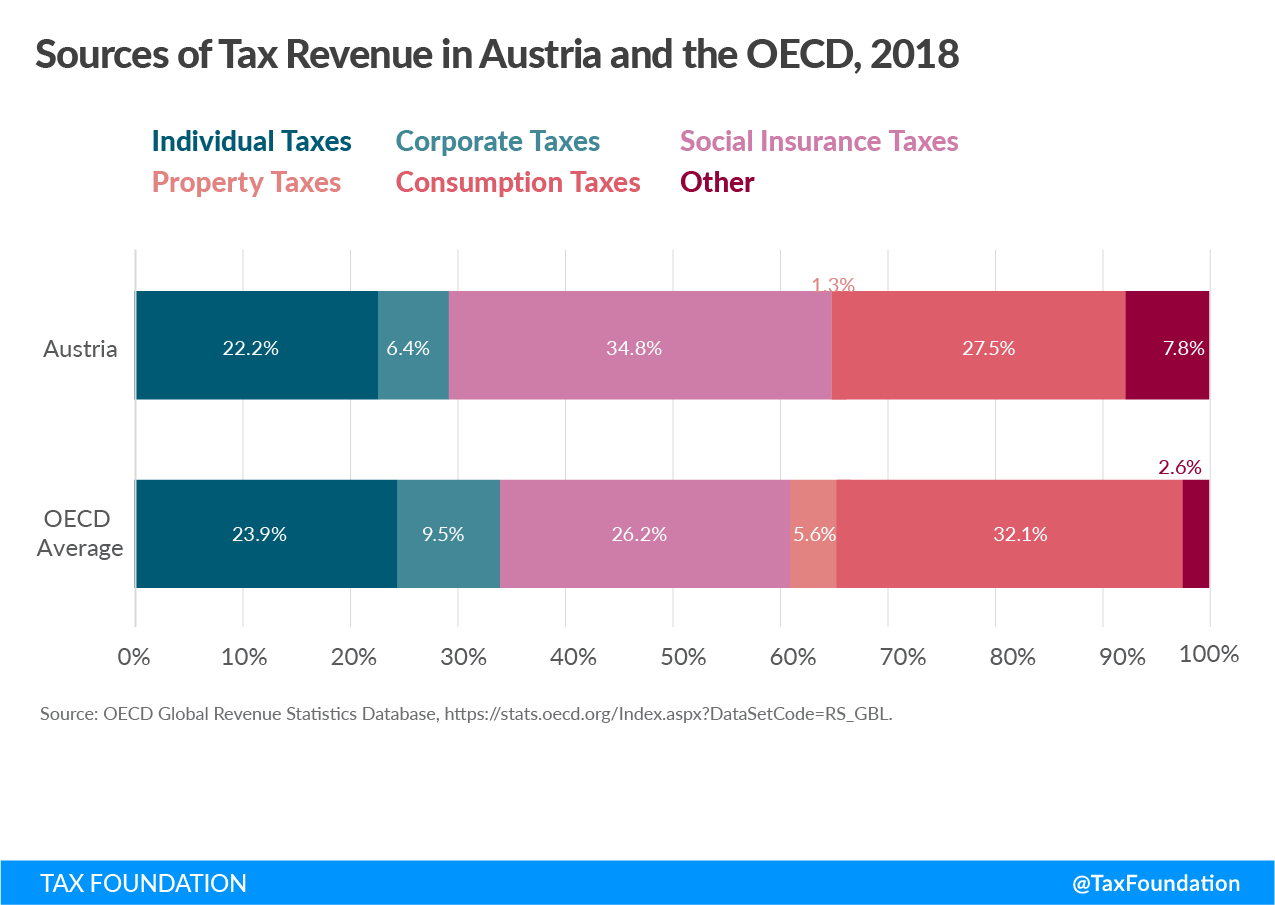
Austria relied less on individual income, corporate income taxes, property taxes, and consumption taxes than the OECD average.
Compared to the OECD average, Austria relied significantly more on social insurance taxes and other taxes. While OECD countries on average raised 26.2 percent of total tax revenue from social insurance taxes, the share in Austria was 34.8 percent, a difference of almost 9 percentage points. Also, as part of the “other taxes” category, Austria relied heavily on payroll and workforce taxes that, in 2018, represented 6.4 percent of the total tax revenue.

In 2018, consumption taxes accounted for 39 percent of Greece’s tax revenue, compared to an OECD average of approximately one-third, making it the country’s most important revenue source. Greece’s shares of social insurance taxes and property taxes were also above the OECD average. At the same time, the country relied less on revenue from individual income taxes and corporate income taxes.
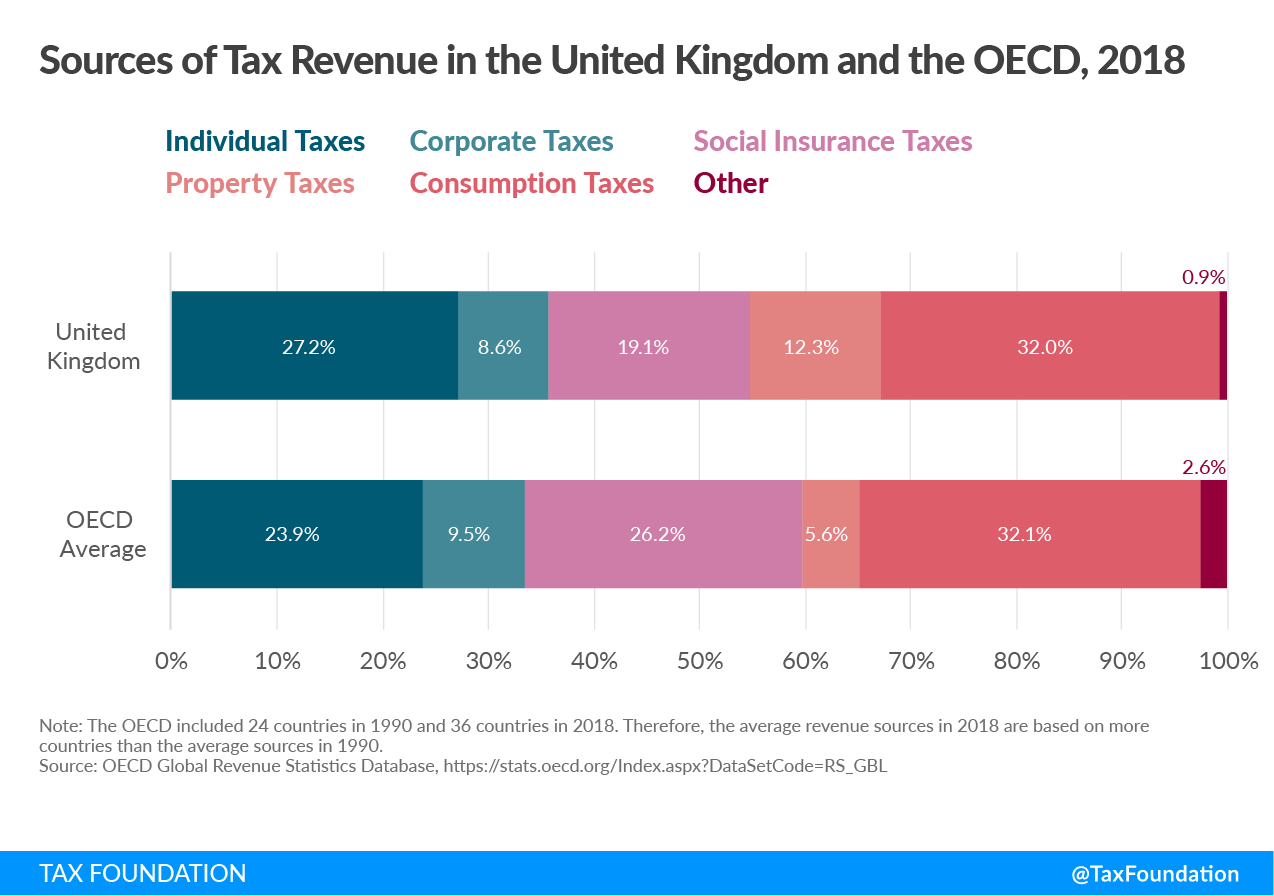
The United Kingdom’s individual income tax revenue share is above the OECD average. In 2018, the United Kingdom was the country that most relied on property taxes in the OECD (12.3 percent).
The United Kingdom relied less on corporate income taxes and social insurance taxes, while its share of consumption tax revenue is similar to the OECD average.
Sources of Tax Revenue by Region
When looking at the sources of tax revenue by region, including non-OECD countries, there is a lot of variation, reflecting economic and social differences across regions.
In 2018, consumption taxes were Africa’s main source of tax revenue, accounting for 54 percent of its total tax revenue, above the OECD average, at 32 percent. Africa also relied more on corporate income taxes and other taxes than the OECD average. Africa’s share of social insurance taxes and individual taxes was far below the OECD averages for these two sources of revenue.
Asia’s main sources of tax revenue in 2018 were consumption taxes and corporate income taxes. These sources’ share in the revenue mix is above the OECD average. On the other hand, Asia collected only 15.7 percent of its total revenue from individual income taxes and 12.2 percent from social insurance taxes, both below the OECD average. Asia’s property taxes’ share in the revenue mix is similar to the OECD average (Table 2, below).
Europe’s distribution of revenue sources is similar to the OECD average distribution, partly due to many European countries being part of the OECD. Nevertheless, compared to the OECD average, Europe relied more on social insurance taxes.
In 2018, consumption taxes were North America’s main source of tax revenue, in spite of the United States’ low share of consumption taxes as a source of revenue. North American countries also rely more on corporate income taxes and other taxes than the OECD average. On the other hand, North America relied less on individual income taxes, social insurance taxes, and property taxes than the OECD average.
Consumption taxes also accounted for 58 percent of Oceania’s tax revenue, compared to an OECD average of approximately one-third, making consumption taxes the region’s most important revenue source. At the same time, Oceania relied more on corporate income taxes and less on other taxes than the OECD average. Also, its share of individual income taxes is similar to the OECD average; there are no social insurance taxes collected in these countries.
South America’s consumption taxes’ share is also above the OECD average, at 48 percent. At the same time, South American countries relied more on corporate income taxes and other taxes than the OECD average. On the other hand, South America relied less on individual income taxes, at around 7 percent, compared to an OECD average of almost one-fourth of total revenue. It also relied less on social insurance taxes than the OECD average.

Conclusion
In general, OECD countries lean more on tax revenue from consumption taxes, social insurance taxes, and individual income taxes than on corporate income taxes and property taxes.
When looking at both OECD and non-OECD countries by region, Asia, Africa, and South America rely more on consumption taxes and corporate income taxes and less on income and social insurance taxes compared to the OECD average. On average OECD and non-OECD countries in North America rely more on corporate income taxes and “other taxes” than the OECD average and less on social insurance and individual taxes. On the other hand, Oceania doesn’t rely at all on social insurance taxes, while consumption taxes are the region’s most important revenue source.
Compared to 1990, OECD countries have on average become more reliant on consumption taxes and less reliant on individual income taxes. These policy changes matter, considering that consumption-based taxes raise revenue with less distortionary effects than taxes on income.
|
(a) Data for Australia, Japan, and Mexico is from 2017 because 2018 data was not available yet. (b) For Greece, only the aggregate taxes on income, profits and capital gains was available for the year 2018. To split this aggregate into the three subcategories individual income taxes, corporate income taxes and other income taxes, each subcategory’s average share of the three years prior (2015-2017) was used to weight it. Source: OECD Global Revenue Statistics Database, https://stats.oecd.org/Index.aspx?DataSetCode=RS_GBL |
||||||
| Individual Taxes | Corporate Taxes | Social Insurance Taxes | Property Taxes | Consumption Taxes | Other | |
|---|---|---|---|---|---|---|
| Australia (a) | 40.3% | 18.5% | 0.0% | 10.3% | 26.0% | 4.8% |
| Austria | 22.2% | 6.4% | 34.8% | 1.3% | 27.5% | 7.8% |
| Belgium | 27.0% | 9.8% | 30.1% | 7.8% | 24.4% | 0.9% |
| Canada | 36.5% | 11.1% | 14.0% | 11.7% | 23.4% | 3.4% |
| Chile | 6.7% | 22.1% | 6.9% | 5.1% | 53.3% | 5.8% |
| Czech Republic | 12.2% | 9.8% | 44.1% | 1.3% | 32.1% | 0.5% |
| Denmark | 54.4% | 6.5% | 0.1% | 4.1% | 32.7% | 2.2% |
| Estonia | 16.5% | 6.1% | 34.9% | 0.7% | 41.3% | 0.5% |
| Finland | 28.9% | 6.0% | 27.9% | 3.4% | 33.6% | 0.2% |
| France | 20.6% | 4.6% | 34.9% | 8.9% | 25.0% | 6.1% |
| Germany | 27.2% | 5.6% | 37.7% | 2.7% | 26.2% | 0.6% |
| Greece (b) | 15.6% | 5.8% | 30.1% | 7.9% | 39.0% | 1.7% |
| Hungary | 14.2% | 3.2% | 33.2% | 2.7% | 44.0% | 2.7% |
| Iceland | 39.6% | 6.9% | 9.5% | 5.5% | 32.6% | 5.9% |
| Ireland | 31.3% | 14.4% | 17.0% | 5.9% | 30.0% | 1.2% |
| Israel | 20.6% | 10.4% | 16.7% | 10.3% | 36.5% | 5.6% |
| Italy | 25.6% | 4.5% | 31.1% | 6.1% | 28.3% | 4.4% |
| Japan (a) | 18.8% | 11.8% | 39.9% | 8.2% | 21.0% | 0.2% |
| Korea | 18.4% | 15.7% | 25.4% | 11.6% | 26.3% | 2.6% |
| Latvia | 19.2% | 3.4% | 29.3% | 3.0% | 44.5% | 0.6% |
| Lithuania | 13.5% | 5.1% | 42.1% | 1.0% | 37.5% | 0.9% |
| Luxembourg | 23.7% | 14.8% | 27.4% | 9.8% | 24.1% | 0.3% |
| Mexico (a) | 21.4% | 21.8% | 13.3% | 1.9% | 36.4% | 5.3% |
| Netherlands | 20.6% | 9.0% | 36.0% | 4.0% | 29.3% | 1.1% |
| New Zealand | 36.9% | 15.6% | 0.0% | 6.0% | 38.5% | 3.1% |
| Norway | 25.3% | 15.3% | 25.9% | 3.3% | 30.1% | 0.1% |
| Poland | 15.2% | 6.0% | 37.5% | 3.8% | 35.1% | 2.5% |
| Portugal | 18.7% | 9.5% | 26.8% | 4.1% | 39.6% | 1.3% |
| Slovak Republic | 10.8% | 9.7% | 44.1% | 1.2% | 33.1% | 1.1% |
| Slovenia | 14.6% | 5.3% | 40.0% | 1.7% | 38.0% | 0.5% |
| Spain | 22.1% | 7.2% | 33.8% | 7.3% | 29.1% | 0.5% |
| Sweden | 29.0% | 6.8% | 22.0% | 2.2% | 28.0% | 12.0% |
| Switzerland | 30.5% | 10.7% | 23.6% | 7.6% | 20.8% | 6.8% |
| Turkey | 15.4% | 8.7% | 29.9% | 4.3% | 40.5% | 1.1% |
| United Kingdom | 27.2% | 8.6% | 19.1% | 12.3% | 32.0% | 0.9% |
| United States | 40.7% | 4.4% | 25.1% | 12.2% | 17.6% | 0.0% |
| OECD Simple Average | 23.9% | 9.5% | 26.2% | 5.6% | 32.1% | 2.6% |
|
* Data for Australia, Japan, Mexico and non-OECD countries is from 2017 because 2018 data was not available yet. Source: OECD Global Revenue Statistics Database, https://stats.oecd.org/Index.aspx?DataSetCode=RS_GBL |
|||||||
| Region or Group | Individual Taxes | Corporate Taxes | Social Insurance Taxes | Property Taxes | Consumption Taxes | Other | Number of Countries Covered |
|---|---|---|---|---|---|---|---|
| OECD | 23.9% | 9.5% | 26.2% | 5.6% | 32.1% | 2.6% | 36 |
| Europe | 23.0% | 7.8% | 29.7% | 4.6% | 32.5% | 2.4% | 27 |
| Asia | 15.7% | 23.0% | 12.2% | 6.0% | 37.6% | 5.5% | 9 |
| North America | 13.4% | 12.9% | 16.0% | 3.7% | 47.0% | 7.0% | 16 |
| Africa | 14.8% | 17.9% | 6.8% | 1.4% | 53.7% | 5.3% | 26 |
| South America | 7.1% | 15.7% | 18.9% | 4.6% | 48.0% | 5.8% | 10 |
| Oceania | 25.4% | 13.2% | 0.0% | 2.6% | 57.9% | 0.9% | 9 |
[1] EY, “2019 Global Oil and Gas Tax Guide, Norway,” 2019, https://www.ey.com/gl/en/services/tax/global-oil-and-gas-tax-guide—xmlqs?preview&XmlUrl=/ec1mages/taxguides/GOG-2017/GOG-NO.xml.
[2] OECD, “Global Revenue Statistics Database,” https://stats.oecd.org/Index.aspx?DataSetCode=RS_GBL.
[3] All averages in this report are simple averages, not weighted averages.
[4] Daniel Bunn and Elke Asen, “Higher Corporate Tax Revenues Globally Despite Lower Tax Rates,” Tax Foundation, Jan. 22, 2019, https://taxfoundation.org/higher-corporate-tax-revenues-lower-tax-rates/.
[5] Janelle Cammenga, “State and Local Sales Tax Rates, 2020” Tax Foundation, Jan. 15, 2020, https://taxfoundation.org/2020-sales-taxes/.
Source: Tax Policy – Sources of Government Revenue in the OECD
 Upstate Tax Professionals