Tax Policy – Comparison of Cross-Border Effective Average Tax Rates in Europe and G7 Countries
Key Findings
- Effective Average Tax Rates (EATRs) on domestic and cross-border investment can influence business decisions and overall investment activity.
- This report provides a summary of domestic as well as cross-border EATRs—for both inbound and outbound investments—among 32 countries in Europe and the Group of Seven (G7) countries.
- Over the last decade EATRs on cross-border investment among G7 countries have fallen from 35.18 percent in 2009 to 29.29 percent in 2019.
- Among G7 countries, Italy has the highest EATR on outbound investment to other G7 countries (31.63 percent) while the U.S. has the lowest (27.77 percent).
- EATRs on cross-border investment among 32 European countries have fallen from 22.65 percent in 2009 to 19.79 percent in 2019.
- Among European countries, Latvia has the highest EATR on outbound investment to other European countries (29.41 percent) while Portugal has the lowest (16.35 percent).
- Policymakers should consider the value created by cross-border trade and investment when making trade-offs between lower tax barriers on cross-border flows and higher tax revenue.
Introduction
In the current globalized economy, businesses have supply chains that can cross borders multiple times. It is often assumed that if a business chooses to locate its production abroad, the home country faces negative economic consequences.
At the heart of this concern lies a misconception that the overall level of investment in the economy is a fixed pie. On the contrary, evidence shows that lowering barriers to outbound investment not only improves opportunities to invest abroad but can also drive more value back to the home country.[1] In other words, policies that facilitate cross-border activity don’t just redistribute where investment occurs but can support overall growth.
For multinational businesses, the tax barriers to cross-border investment can influence how a business decides to reach its customers in foreign markets. A company headquartered in the United States that wants to sell its products abroad could choose to:
- Produce its products in the U.S. and then export those goods to foreign markets
or
- Invest in foreign subsidiaries that will produce goods for foreign customers
The first option can make economic sense if there are very low costs to transport goods to foreign markets. Digital business models may be able to serve foreign customers remotely without facing shipping costs or tariffs at foreign borders. A car manufacturer, on the other hand, may find that investing in a foreign production facility would allow the company to compete with other car manufacturers selling in the foreign country.
A U.S.-based multinational that wants to reach customers in the UK has to consider not only whether to produce in the U.S. or in the UK but also whether another country near the UK could be a valuable production location for serving UK customers.
Tax policies can directly impact these decisions and the competitive environment that multinationals face. The U.S.-based company would not only be competing against UK companies that are trying to sell to UK customers but also other foreign firms that are selling in the UK market.
Policymakers may be interested in ways to promote domestic production, but there is also a role that policy plays in providing a competitive footing for domestic companies competing abroad.
One way to measure that policy impact is by examining cross-country tax differences that impact domestic taxpayers and multinational companies.
Effective average tax rates (EATRs) measure the average tax burden on investments. EATRs are calculated to capture tax policies that impact both domestic and cross-border investment decisions.[2]
This report provides a summary of cross-border EATRs among 32 countries in Europe and the Group of Seven (G7) countries.[3]
In 2019, EATRs on cross-border investment averaged 19.79 percent among the European countries and 29.29 percent among the G7 countries. Since 2009, cross-border EATRs have fallen by 2.64 percentage points on average among European countries and 5.9 percentage points on average among G7 countries.[4]
Over the last decade, reductions in corporate tax rates have contributed to lower cross-border EATRs. Among European countries, relatively lower corporate tax rates and withholding taxes on cross-border dividends and interest payments result in lower cross-border EATRs on average.
Recent shifts in the U.S. and other countries toward territorial taxation have also lowered the tax burden on cross-border investment. Policies that would create new barriers to investment could decrease foreign direct investment (FDI) and diminish the positive effects from trade.
Why Do EATRs Matter?
An EATR is measured using a theoretical approach that incorporates key tax policy measures that impact business investment decisions. The EATR is the average tax burden that a business would face on a range of profitable investments.[5]
Both purely domestic tax policies and those that impact cross-border investment can shift the location of business investments and FDI flows. Empirical evidence using EATRs that capture domestic and cross-border tax policies has shown that higher bilateral EATRs are associated with lower levels of FDI between a pair of countries.[6]
For example, if the tax burden on investments from the U.S. to the UK is relatively high, then outbound FDI from the U.S. to the UK would tend to be lower (other things being equal). The domestic tax burden can also impact FDI. If the UK places a higher tax burden on its domestic businesses relative to the tax burden on inbound foreign investments from the U.S. to the UK, then FDI from the U.S. to the UK could increase.[7] This is because UK subsidiaries of U.S. multinationals would have a stronger competitive stance relative to domestic UK companies if those domestic companies face a tax disadvantage.
These cross-border and domestic effects are particularly important when considering the growth of trade and investment flows over the last century and how that has created more competition for domestic production.
Measuring Domestic and Cross-Border Effective Average Tax Rates: An Example
As mentioned previously, EATRs measure various tax policies that impact investment decisions. The approach used to measure cross-border EATRs includes the following key variables:
- Corporate tax rates in both the foreign and domestic jurisdictions
- Capital cost allowances in the foreign jurisdiction
- Territorial provisions in the domestic jurisdiction
- The tax treatment of foreign-earned dividends and interest payments back to the parent company in the domestic jurisdiction
Purely domestic EATR measures include all the above except for territorial provisions and the tax treatment of dividends and interest payments back to parent companies. Domestic EATR measures also account for capital cost allowances in the domestic jurisdiction.
This arrangement captures the fact that foreign subsidiaries generally pay tax under the foreign tax system like a domestic company. However, depending on the tax system in which the parent company is located, there might be a second layer of taxation when the foreign profits are repatriated (or even if they are not repatriated). Therefore, cross-border EATRs include information on foreign tax systems, domestic tax systems, and the rules that impact the repatriation of foreign-earned profits.
Additionally, EATRs can capture different types of investment opportunities and financing arrangements. The approach used by the study that this report relies on focuses on five types of investment assets and three ways to combine financing for those investments from the parent or subsidiary.
For instance, a new investment in machinery taken on by a subsidiary could be financed by a combination of debt at the parent company and new equity at the subsidiary level. This report uses EATRs calculated using overall weighted averages of investment opportunities financed by the parent and the subsidiary.
|
Note: Calculating the mean EATR for any given country or country pair (in the case of cross-border EATRs) relies on weighting the investment and financing options. The source used for this report weights the investment options equally at 20 percent. The financing options for domestic EATRs are weighted at 55 percent for retained earnings, 10 percent for new equity, and 35 percent for debt. In the context of cross-border EATRs, parent-financed financing options are weighted 55 percent for retained earnings, 10 percent for new equity, and 35 percent for debt. Subsidiary-financed financing options are weighted 33.33 percent for retained earnings, 33.33 percent for new equity, and 33.33 percent for debt. Source: Spengel, et al., “Effective Tax Levels using the Devereux/Griffith Methodology.” |
|
| Investment Opportunities | |
|---|---|
| — Industrial Buildings | |
| — Intangibles | |
| — Machinery | |
| — Financial Assets | |
| — Inventory | |
| Financing the Investment | |
| — Retained Earnings | |
| — New Equity | |
| — Debt | |
For the U.S. and the UK, differences in corporate tax rates, treatment of inventory, and capital allowances result in domestic and cross-border EATRs that are significantly different. For the UK, the domestic EATR is 20.2 percent and for the U.S., 27.5 percent. Outbound investment from the U.S. to the UK faces an EATR of 19.3 percent. Outbound investment from the UK to the U.S., however, faces an EATR of 27.6 percent.
At a broad level, this shows that subsidiaries of UK companies located in the U.S. face a similar tax rate as domestic U.S. companies; however, it is more expensive from a tax perspective for a UK company to invest in the U.S. relative to investing at home.
|
Notes:
Source: Spengel, et al., “Effective Tax Levels using the Devereux/Griffith Methodology.” |
||
| United Kingdom | United States | |
|---|---|---|
| Combined Statutory Taxes on Corporate Profits | 19% | 27.98% (a) |
| Treatment of Inventory | FIFO | LIFO |
| Net Present Value of Capital Allowances for Industrial Buildings | 29.19% | 36.01% |
| Net Present Value of Capital Allowances for Machinery | 82.17% | 100% |
| Net Present Value of Capital Allowances for Intangibles | 87.60% | 64.62% |
| Domestic EATR | 20.20% | 27.50% |
| Territoriality of Foreign Dividend Income | 100% Exemption | 100% Exemption |
| Withholding Tax on Dividends from/to UK or U.S. | 0% | 0% |
| Withholding Tax on Interest from/to UK or U.S. | 0% | 0% |
| EATR on Outbound Investment from the UK or U.S. (b) | 27.60% | 19.30% |
Evolution of EATRs on Investment Between the U.S. and UK
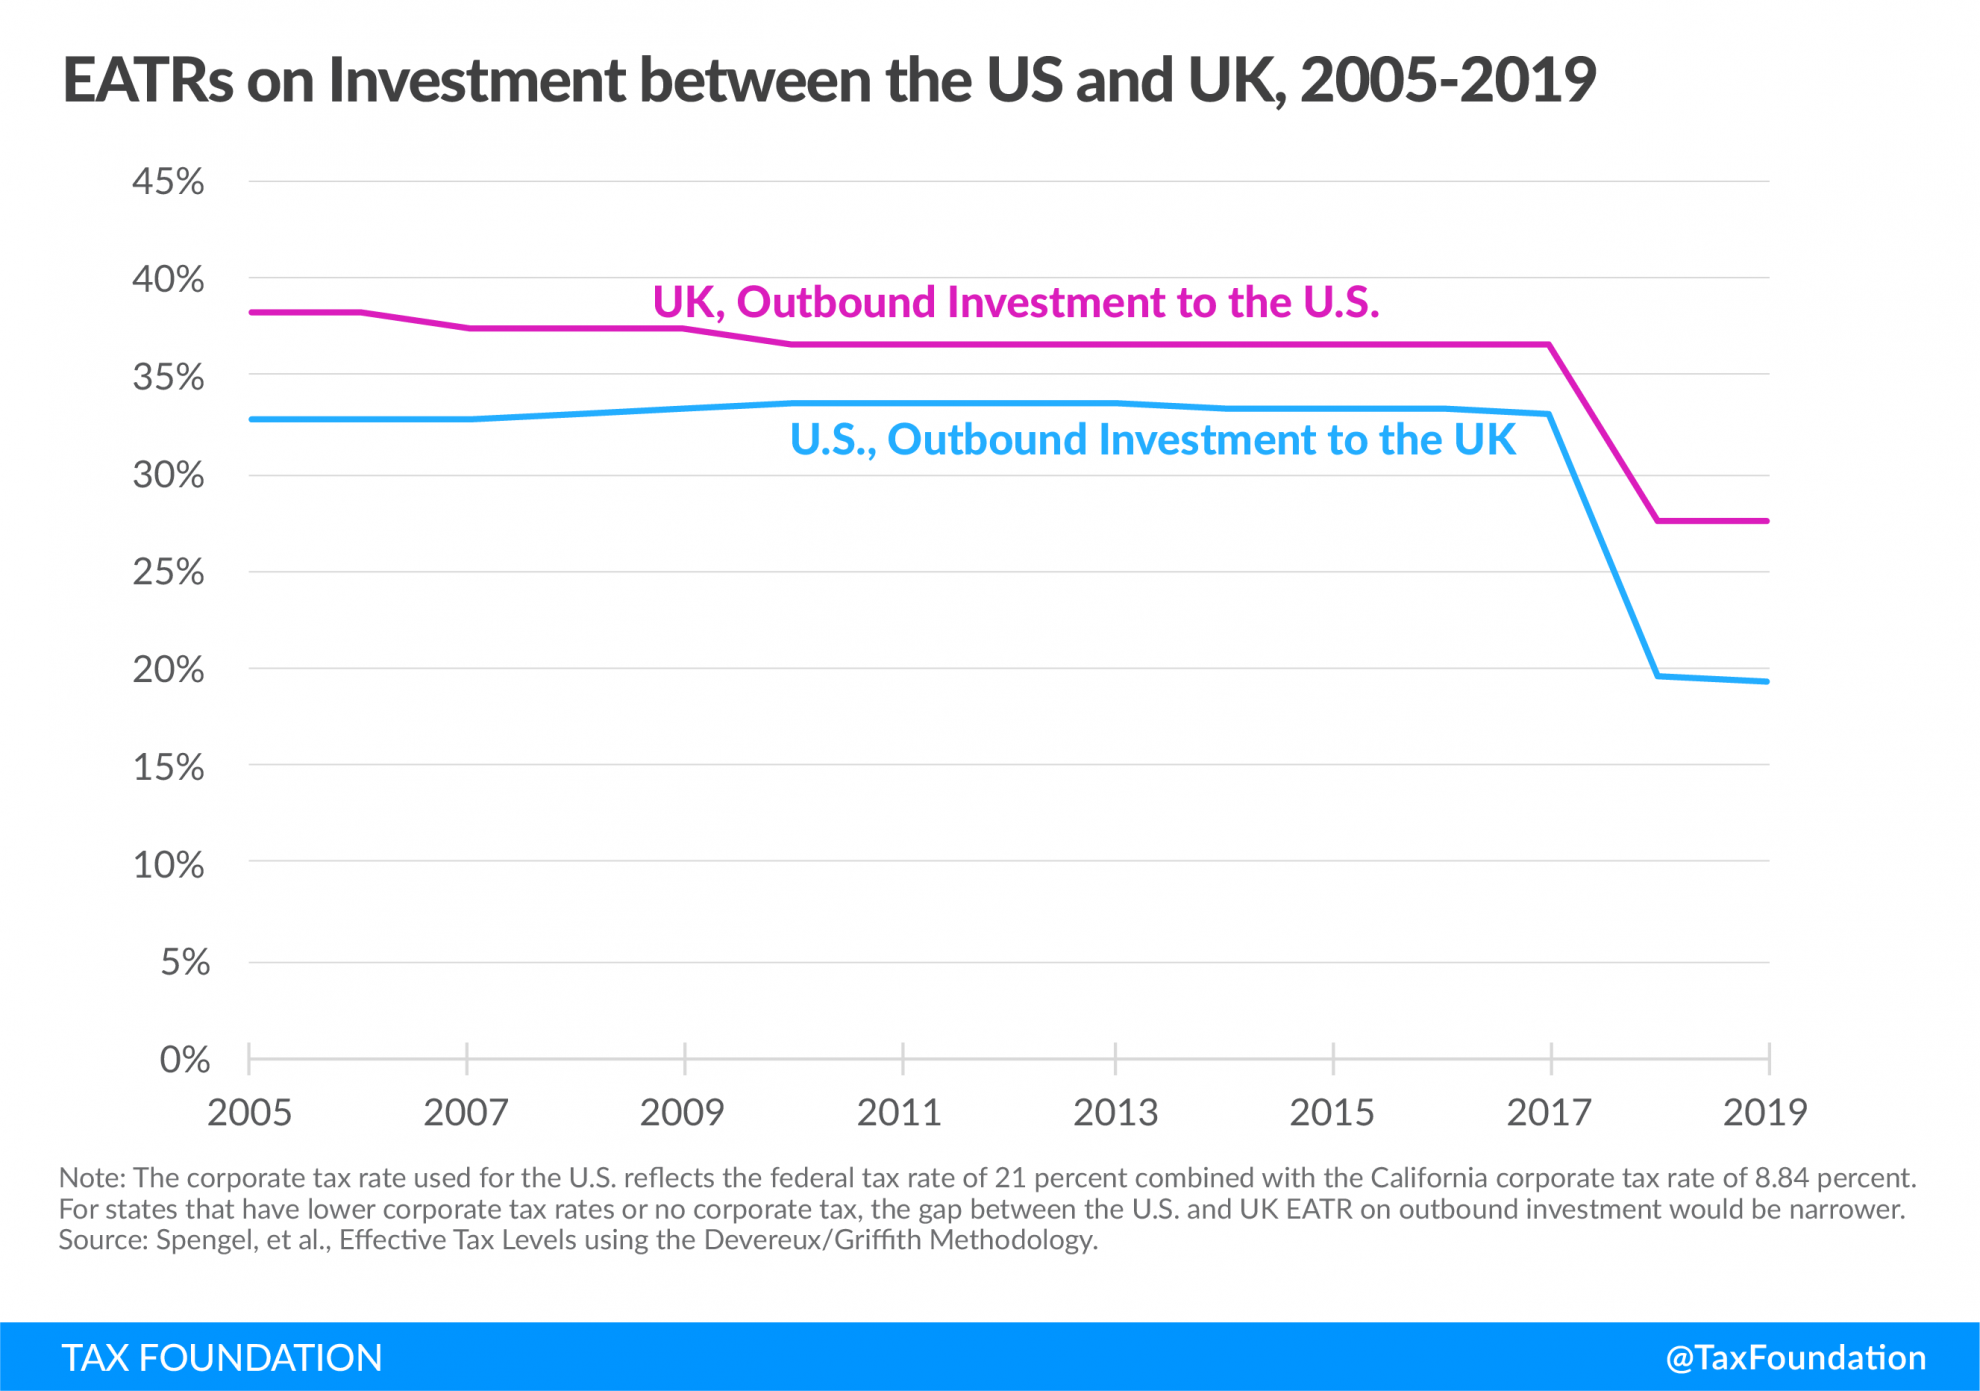
Both the U.S. and the UK have made significant changes to their corporate tax systems in the last two decades. Prior to 2009, both the UK and the U.S. had worldwide systems of taxation, higher corporate taxes than currently, and different treatment of capital allowances.
Starting in 2009, the UK began implementing a series of reforms that led to a territorial tax system, a reduction of its corporate tax rate (from 28 percent in 2010 to 19 percent currently), and reduced write-offs for capital allowances (particularly for industrial buildings).
The U.S. reformed its corporate tax system and international rules in 2017. The U.S. adopted a hybrid territorial system, reduced the federal corporate tax rate from 35 percent to 21 percent, and provided immediate expensing for investments in equipment and machinery.
The U.S. reforms had a more dramatic impact on cross-border EATRs between the countries, but only because the UK had previously adopted a territorial tax system. This indicates the benefit of both countries having territorial tax systems.
Following the U.S. reforms, the EATR on outbound investment from the UK to the U.S. fell 9 percentage points, from 36.6 percent to 27.6 percent. The EATR on outbound investment from the U.S. to the UK fell from 33.1 percent to 19.3 percent. The gap between the EATRs in 2019 roughly reflects the difference in the combined effective corporate tax rates.[8]

Average EATRs among G7 and European Countries
The example above for the U.S. and UK could be replicated for a multitude of country pairs. The source used for this report includes 35 countries including the G7 countries and 32 European countries.
Average EATRs on Investment between G7 Countries
Outbound investment stocks among the G7 countries totaled nearly $5 trillion in 2018.[9] As mentioned, both domestic EATRs and cross-border EATRs can be influential in FDI decisions.
Among G7 countries, average cross-border EATRs on investment to other G7 countries fell from 35.18 percent to 29.19 percent from 2009 to 2019. Average domestic EATRs fell from 32.66 percent to 27.53 percent over that time frame. This means that although domestic and cross-border EATRs are similar, G7 countries, on average, tax domestic investment slightly less than foreign investment.
In 2019, Japan had the highest EATR on domestic (34.1 percent) and inbound (35.85 percent) investment. Italy had the highest EATR on outbound investment to other G7 countries (31.63 percent). The UK had the lowest EATR on domestic (20.2 percent) and inbound (20.8 percent) investment. France had the lowest EATR on outbound investment to other G7 countries (27.52 percent).
|
Note: Cross-border EATRs are averages of EATRs on outbound or inbound investment with other G7 countries. Source: Spengel, et al., “Effective Tax Levels using the Devereux/Griffith Methodology”; author’s calculations. |
||||||
|
2009 |
2019 |
|||||
|---|---|---|---|---|---|---|
|
Cross-Border |
Cross-Border |
|||||
| Country | Domestic | Outbound | Inbound | Domestic | Outbound | Inbound |
| Canada | 31.00 | 35.83 | 35.38 | 24.00 | 30.48 | 27.83 |
| France | 34.70 | 34.08 | 35.95 | 33.40 | 27.52 | 34.42 |
| Germany | 28.00 | 35.97 | 30.87 | 28.90 | 29.25 | 29.68 |
| Italy | 27.50 | 36.90 | 31.08 | 24.60 | 31.63 | 27.08 |
| Japan | 41.70 | 35.17 | 43.88 | 34.10 | 29.03 | 35.85 |
| United Kingdom | 28.30 | 33.88 | 29.85 | 20.20 | 29.33 | 20.80 |
| United States | 37.40 | 34.45 | 39.27 | 27.50 | 27.77 | 29.35 |
| Average | 32.66 | 35.18 | 27.53 | 29.29 | ||
Average EATRs among European Countries
Among European countries, both domestic and cross-border EATRs on investment to other European countries fell, on average, from 2009 to 2019. However, starting at a lower level, the reduction was lower than among the G7 countries.
Among European countries, average cross-border EATRs on investment to other European countries fell from 22.65 percent to 19.79 percent from 2009 to 2019. Average domestic EATRs fell from 21.13 percent to 19.16 percent over that time frame.
In 2019, France had the highest EATR on domestic (33.4 percent) and inbound (34.26 percent) investment. Latvia had the highest EATR on outbound investment to other European countries (29.41 percent). Bulgaria had the lowest EATR on domestic investment (9.0 percent). Portugal had the lowest EATR on outbound investment to other European countries (16.35 percent). Malta had the lowest EATR on inbound investment from other European countries (2.95 percent).
Smaller countries, on average, tend to have lower EATRs on cross-border investment, particularly for inbound investments,
|
Note: Cross-border EATRs are averages of EATRs on outbound or inbound investment with other European countries. Source: Spengel, et al., “Effective Tax Levels using the Devereux/Griffith Methodology”; author’s calculations. |
||||||
| 2009 | 2019 | |||||
|---|---|---|---|---|---|---|
| Cross-Border | Cross-Border | |||||
| Country | Domestic | Outbound | Inbound | Domestic | Outbound | Inbound |
| Austria | 22.70 | 20.67 | 24.24 | 23.10 | 18.44 | 23.80 |
| Belgium | 24.70 | 20.29 | 25.33 | 24.90 | 18.46 | 25.61 |
| Bulgaria | 8.80 | 21.22 | 11.27 | 9.00 | 19.19 | 10.10 |
| Croatia | 16.50 | 23.17 | 18.03 | 14.80 | 18.97 | 16.10 |
| Cyprus | 10.60 | 22.21 | 12.61 | 13.40 | 16.75 | 14.26 |
| Czech Republic | 17.50 | 22.52 | 19.20 | 16.70 | 20.45 | 17.62 |
| Denmark | 22.60 | 20.80 | 23.65 | 19.80 | 18.90 | 20.45 |
| Estonia | 16.50 | 22.95 | 19.27 | 13.90 | 20.51 | 15.81 |
| Finland | 23.60 | 20.63 | 24.96 | 19.60 | 18.74 | 20.36 |
| France | 34.70 | 21.34 | 35.53 | 33.40 | 18.41 | 34.26 |
| Germany | 28.00 | 22.43 | 29.31 | 28.90 | 20.09 | 29.62 |
| Greece | 30.50 | 30.98 | 31.91 | 26.60 | 21.39 | 28.09 |
| Hungary | 19.50 | 20.86 | 20.66 | 11.10 | 19.19 | 12.06 |
| Ireland | 14.40 | 22.72 | 16.12 | 14.10 | 20.03 | 14.96 |
| Italy | 27.50 | 21.81 | 28.87 | 24.60 | 20.89 | 25.70 |
| Latvia | 13.80 | 21.02 | 15.89 | 16.70 | 29.41 | 18.51 |
| Lithuania | 16.80 | 20.77 | 18.15 | 12.70 | 18.92 | 13.40 |
| Luxembourg | 25.00 | 23.02 | 26.31 | 21.80 | 20.94 | 22.35 |
| Macedonia | 7.90 | 29.79 | 14.88 | 9.70 | 22.05 | 14.98 |
| Malta | 32.20 | 21.35 | 10.47 | 25.30 | 17.13 | 2.95 |
| Netherlands | 22.20 | 20.57 | 23.27 | 22.50 | 18.57 | 23.25 |
| Norway | 26.50 | 21.89 | 28.40 | 20.80 | 19.54 | 21.77 |
| Poland | 17.50 | 21.00 | 19.28 | 16.60 | 17.99 | 17.57 |
| Portugal | 23.70 | 21.26 | 25.76 | 21.40 | 16.35 | 22.55 |
| Romania | 14.80 | 21.13 | 16.96 | 14.70 | 20.51 | 15.56 |
| Slovak Republic | 16.80 | 22.35 | 18.09 | 18.70 | 20.41 | 19.30 |
| Slovenia | 19.10 | 21.49 | 20.78 | 17.30 | 19.49 | 18.25 |
| Spain | 32.80 | 20.82 | 33.82 | 30.10 | 19.24 | 31.06 |
| Sweden | 23.20 | 20.64 | 24.14 | 19.40 | 18.78 | 20.02 |
| Switzerland | 18.70 | 20.93 | 21.10 | 18.60 | 18.71 | 19.54 |
| Turkey | 18.60 | 26.43 | 27.56 | 12.70 | 23.16 | 19.65 |
| United Kingdom | 28.30 | 25.92 | 29.15 | 20.20 | 18.77 | 20.81 |
| Average | 21.13 | 22.65 | 19.16 | 19.79 | ||
The Effects of Cross-Country Differences in EATRs on Investment Locations
High EATRs on cross-border investment between countries can lower bilateral investment flows. However, businesses can channel activity through lower-tax jurisdictions to facilitate activity in higher-tax jurisdictions to minimize the tax impact on the cross-border investment. A significant body of research has shown that businesses do channel their investments in this manner, and countries have responded with policies that aim to minimize the use of lower-tax jurisdictions to avoid the tax burdens in higher-tax jurisdictions.[10]
For example, a business in the U.S. could invest in an Irish subsidiary to sell to clients in the UK. The EATR on outbound investment from the U.S. to Ireland is 13.2 percent, significantly lower than the corresponding EATR between the U.S. and the UK (19.3 percent). This simple arrangement allows the business to lower the tax on business profits from selling to UK clients.
This simple example could be complicated by the presence (or absence) of tariffs and other trade barriers, critical infrastructure, and a skilled workforce. However, if two countries have similar levels of these other key economic features, then EATRs on cross-border investment can play a more significant role in driving investment location choices.
For firms that rely less on physical investment and physical production in their value chains, the opportunity to exploit differences in domestic and cross-border EATRs is greater. This can be particularly true for businesses with valuable intangible assets. Policies to address the exploitation of these tax differences are therefore more often focused on investment flows that can more easily be shifted to lower tax jurisdictions.[11]
Conclusion
As countries have reduced corporate tax rates and lowered barriers to cross-border investment by adopting territorial tax systems, EATRs have fallen. However, EATRs on investment flows among the G7 countries are significantly higher than among European countries and smaller countries.
As policymakers consider ways to facilitate investment, EATRs provide a valuable perspective on where burdens on those activities are high and where they are low. Evidence on the complementary relationship between foreign and domestic investment should lead to policies that remove barriers to investment and trade.[12]
Balancing low EATRs on investment against policies to address opportunities to exploit tax differences between countries necessarily requires trading off burdens on cross-border investment against revenue considerations. However, providing a sure footing for investment can boost long-term growth and provide sources of revenue that might not arise in the context of barriers to trade and investment.
[1] Mihir A. Desai, C. Fritz Foley, and James R. Hines Jr., “Foreign Direct Investment and the Domestic Capital Stock,” AEA Papers and Proceedings 95:2 (May 2005), https://www.aeaweb.org/articles?id=10.1257/000282805774670185.
[2] Michael P. Devereux and Rachel Griffith, “The Taxation of Discrete Investment Choices,” Institute for Fiscal Studies, Working Paper 98/16, February 1999, https://www.ifs.org.uk/wps/wp9816.pdf.
[3] The 32 European countries are: Austria, Belgium, Bulgaria, Croatia, Cyprus, Czech Republic, Denmark, Estonia, Finland, France, Germany, Greece, Hungary, Ireland, Italy, Latvia, Lithuania, Luxembourg, Malta, Netherlands, North Macedonia, Norway, Poland, Portugal, Romania, Slovak Republic, Slovenia, Spain, Sweden, Switzerland, Turkey, and United Kingdom.
The G7 countries are: Canada, France, Germany, Italy, Japan, United Kingdom, and United States. France, Germany, Italy, and United Kingdom belong to both groups.
The average cross-border EATRs are calculated for outbound and inbound investment among only the countries in the groups.
[4] Christoph Spengel, Frank Schmidt, Jost Heckmeyer, and Katharina Nicolay, “Effective Tax Levels Using the Devereux/Griffith Methodology,” European Commission, November 2019, https://ec.europa.eu/taxation_customs/sites/taxation/files/final_report_2019_effective_tax_levels_revised_en.pdf.
[5] Michael P. Devereux and Rachel Griffith, “Evaluating Tax Policy for Location Decisions,” International Tax and Public Finance 10 (2003), https://link.springer.com/article/10.1023/A:1023364421914.
[6] Peter Egger, Simon Loretz, Michael Pfaffermayr, and Hannes Winner, “Bilateral Effective Tax Rates and Foreign Direct Investment,” International Tax and Public Finance 16 (2009), https://link.springer.com/article/10.1007/s10797-008-9092-x.
[7] Ibid.
[8] As mentioned, the corporate tax rate used for the U.S. reflects the federal tax rate of 21 percent combined with the California corporate tax rate of 8.84 percent. For states that have lower corporate tax rates or no corporate tax, the gap between the U.S. and UK EATR on outbound investment would be narrower.
[9] OECD, “OECD International Direct Investment Statistics, Outward FDI stocks by partner country,” April 2019, https://data.oecd.org/fdi/outward-fdi-stocks-by-partner-country.htm#indicator-chart.
[10] For a basic review of the theory and evidence on these phenomena, see Alexander D. Klemm and Li Liu, “The Impact of Profit Shifting on Economic Activity and Tax Competition,” International Monetary Fund, IMF Working Paper 19/287, Dec. 20, 2019, https://www.imf.org/en/Publications/WP/Issues/2019/12/20/The-Impact-of-Profit-Shifting-on-Economic-Activity-and-Tax-Competition-48741, and Nadine Riedel, “Quantifying International Tax Avoidance: A Review of the Academic Literature,” Review of Economics 69:2, July 2, 2018, https://www.degruyter.com/view/j/roe.2018.69.issue-2/roe-2018-0004/roe-2018-0004.xml.
[11] Many anti-avoidance regimes specifically focus on easily shifted investment flows and exclude investments. This is done by creating carve-outs for economic substance or, in the case of the U.S., a deduction based on foreign capital investment. See Daniel Bunn, Kyle Pomerleau, and Sebastian Dueñas, “Anti-Base Erosion Policies and Territorial Tax Systems in OECD Countries,” Tax Foundation, May 2, 2019, https://taxfoundation.org/anti-base-erosion-provisions-territorial-tax-systems-oecd-countries/.
[12] Mihir A. Desai, C. Fritz Foley, and James R. Hines Jr., “Foreign Direct Investment and the Domestic Capital Stock.”
Source: Tax Policy – Comparison of Cross-Border Effective Average Tax Rates in Europe and G7 Countries
 Upstate Tax Professionals