
Tax Policy – Reliance on Consumption Taxes in Europe
Today’s map highlights the extent to which European countries rely on consumption tax revenue.
Consumption taxes are taxes on goods and services. All European countries levy consumption taxes in the form of Value-Added Taxes (VAT), excise taxes, and other taxes on goods and services. In 2018 (most recent data available), consumption taxes were the largest source of tax revenue in European OECD countries, at an average of 32.5 percent of total tax revenue.
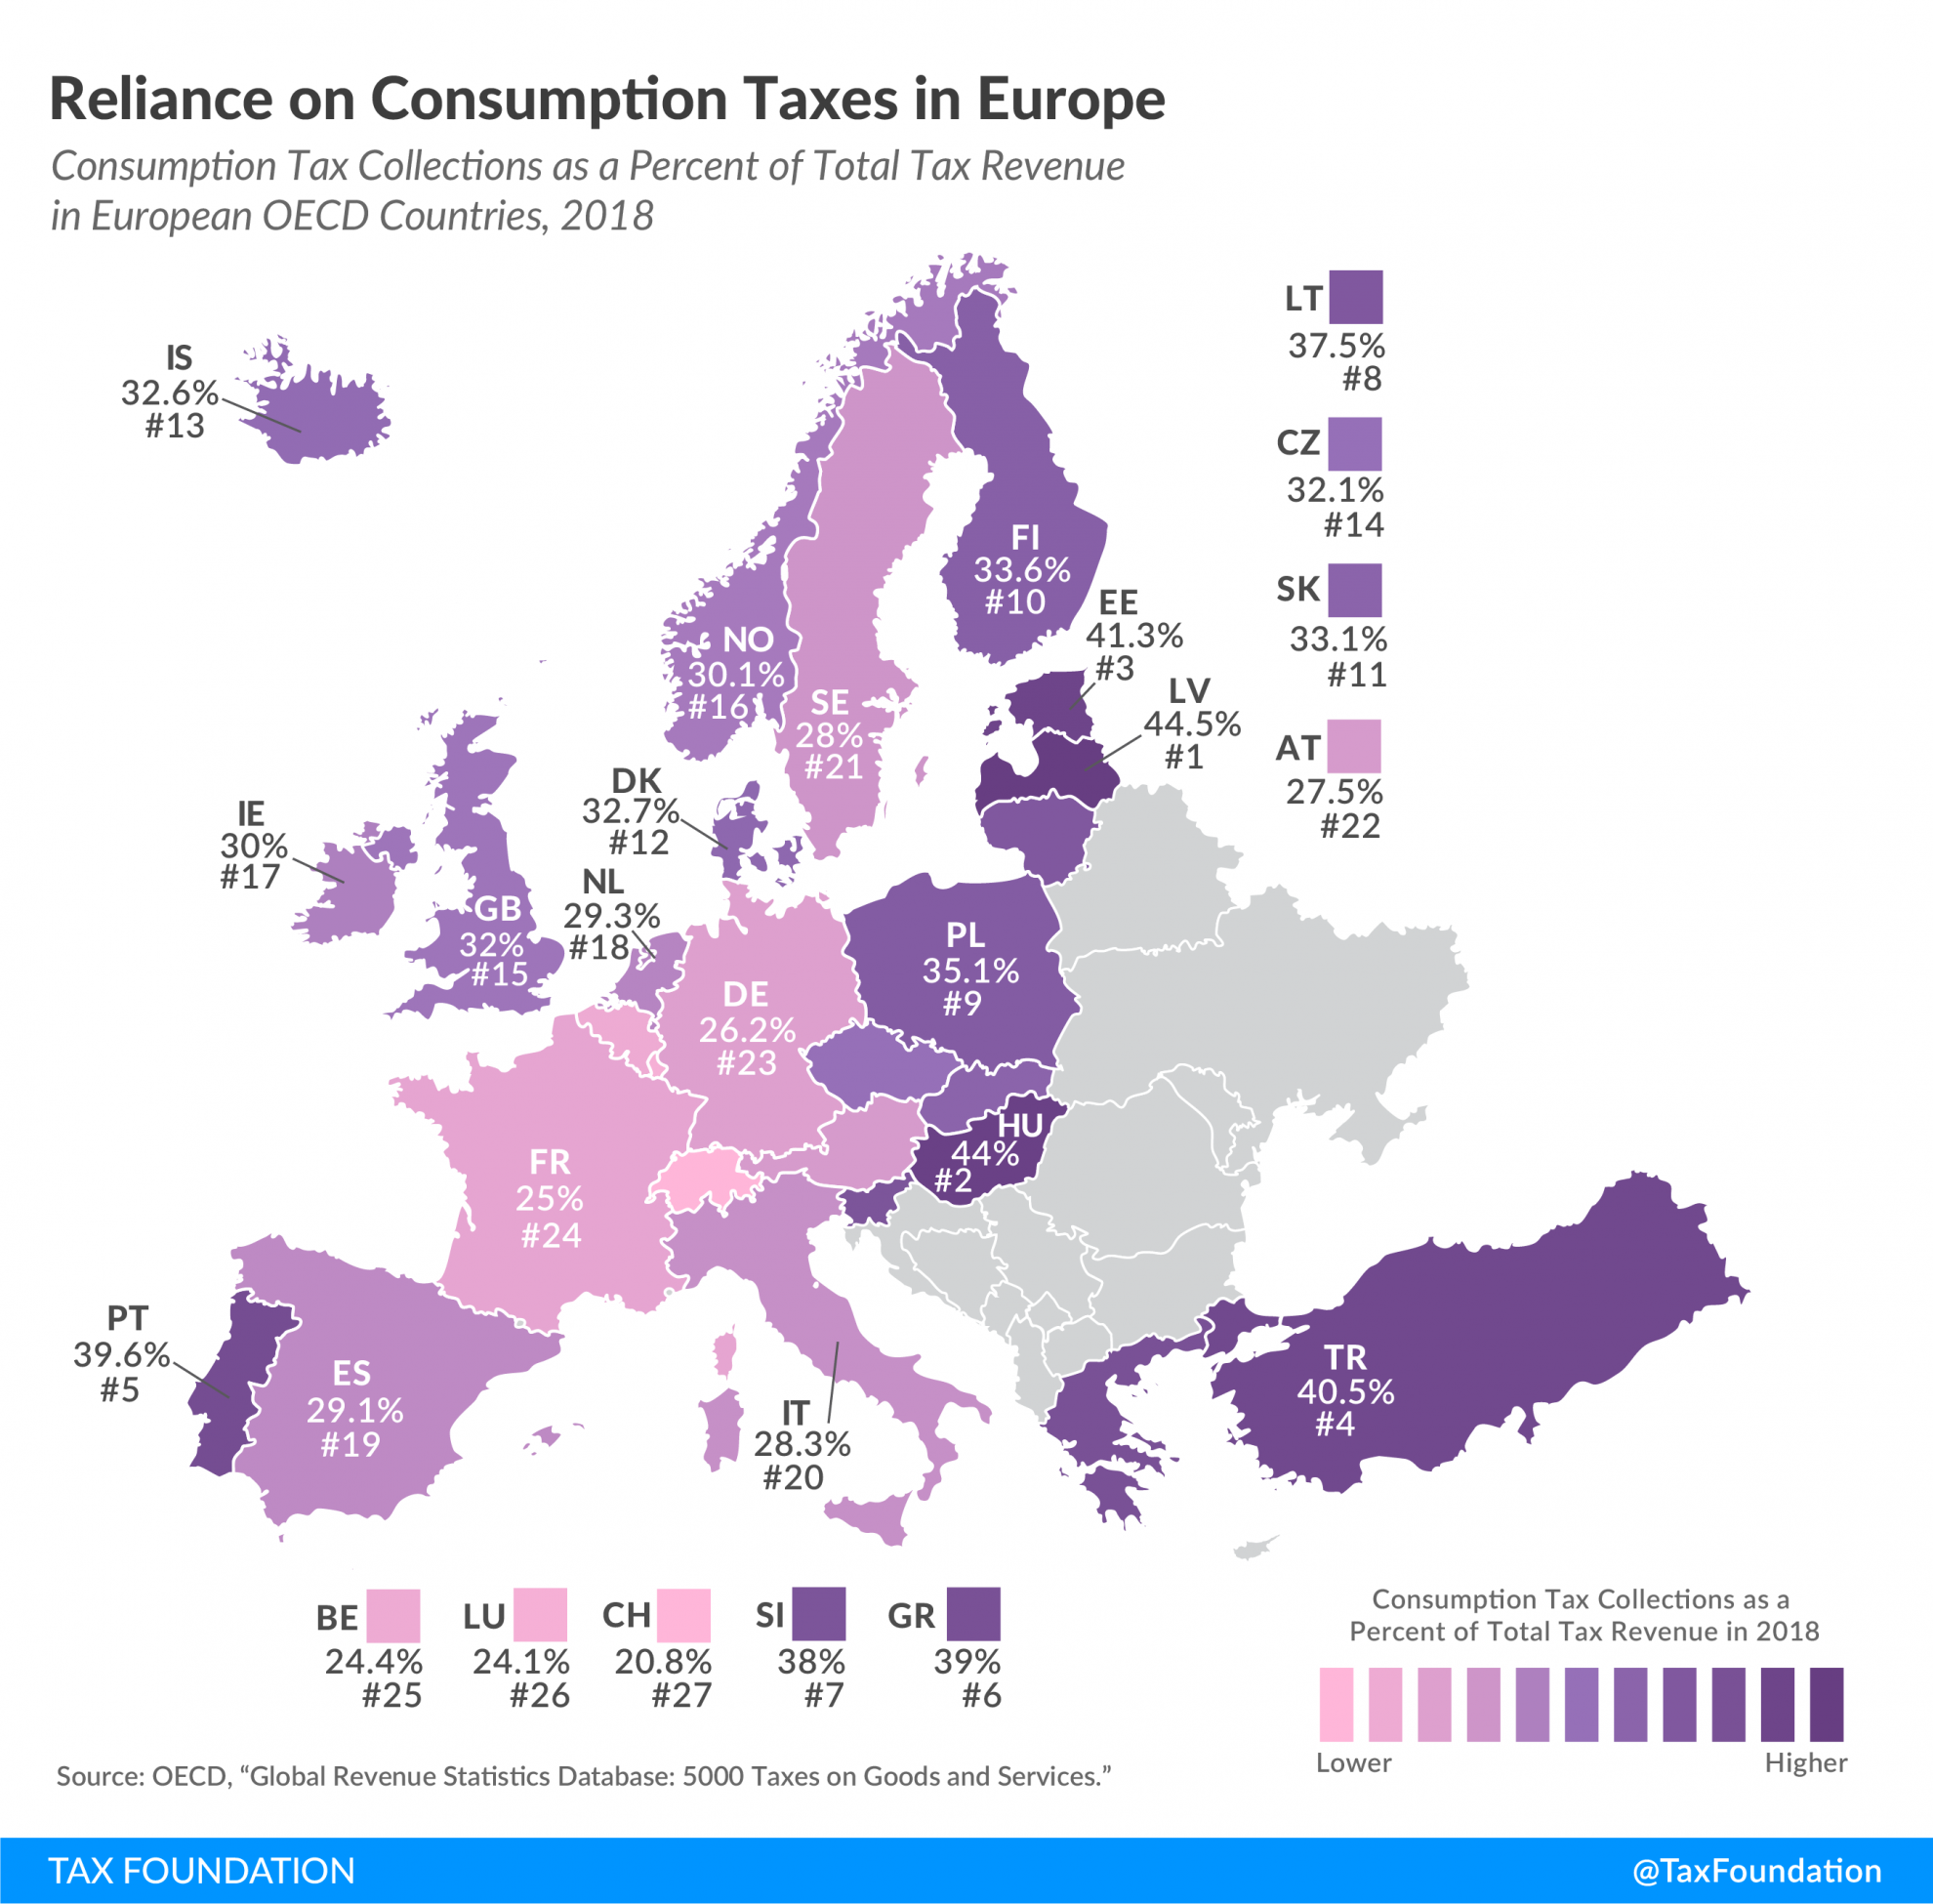
In 2018, Latvia relied the most on consumption tax revenue, at 44.5 percent of total tax revenue. Hungary had the second highest reliance on consumption taxes, at 44.0 percent, followed by Estonia at 41.3 percent.
Switzerland relied the least on consumption taxes in 2018, at 20.8 percent of total tax revenue. Belgium and Luxembourg followed, at 24.1 percent and 24.4 percent, respectively.
As the following table shows, VAT revenue accounted on average for approximately two-thirds of all consumption tax revenue collected in 2018. Excise taxes and other taxes on goods and services accounted for the remaining third.
|
Note: Individual items may not sum to total due to rounding. *For Greece, only the aggregate Taxes on Goods and Services was available for the year 2018. The share of VAT and Excise Taxes and Other Taxes on Goods and Services was calculated using 2017 data. Source: OECD, “Global Revenue Statistics Database,” https://stats.oecd.org/Index.aspx?DataSetCode=RS_GBL. |
|||
| Total Consumption Taxes (% of Total Tax Revenue) | VAT (% of Total Tax Revenue) | Excise Taxes and Other Taxes on Goods and Services (% of Total Tax Revenue) | |
|---|---|---|---|
| Austria (AT) | 27.5% | 18.0% | 9.5% |
| Belgium (BE) | 24.4% | 15.4% | 9.0% |
| Czech Republic (CZ) | 32.1% | 21.7% | 10.3% |
| Denmark (DK) | 32.7% | 21.5% | 11.1% |
| Estonia (EE) | 41.3% | 27.3% | 14.0% |
| Finland (FI) | 33.6% | 21.6% | 12.1% |
| France (FR) | 25.0% | 15.6% | 9.4% |
| Germany (DE) | 26.2% | 18.2% | 8.0% |
| Greece (GR)* | 39.0% | 20.9% | 18.1% |
| Hungary (HU) | 44.0% | 25.5% | 18.5% |
| Iceland (IS) | 32.6% | 22.7% | 9.8% |
| Ireland (IE) | 30.0% | 19.5% | 10.5% |
| Italy (IT) | 28.3% | 14.8% | 13.5% |
| Latvia (LV) | 44.5% | 27.0% | 17.5% |
| Lithuania (LT) | 37.5% | 25.8% | 11.7% |
| Luxembourg (LU) | 24.1% | 15.8% | 8.2% |
| Netherlands (NL) | 29.3% | 17.5% | 11.7% |
| Norway (NO) | 30.1% | 21.7% | 8.3% |
| Poland (PL) | 35.1% | 23.2% | 11.9% |
| Portugal (PT) | 39.6% | 25.0% | 14.6% |
| Slovakia (SK) | 33.1% | 21.2% | 11.9% |
| Slovenia (SI) | 38.0% | 22.5% | 15.4% |
| Spain (ES) | 29.1% | 19.1% | 9.9% |
| Sweden (SE) | 28.0% | 21.1% | 6.9% |
| Switzerland (CH) | 20.8% | 11.8% | 9.0% |
| Turkey (TR) | 40.5% | 19.8% | 20.7% |
| United Kingdom (GB) | 32.0% | 21.0% | 10.9% |
| Average | 32.5% | 20.6% | 11.9% |
In 2018, reliance on VAT was highest in Estonia (27.3 percent), Latvia (27.0 percent), and Lithuania (25.8 percent).
Switzerland relied the least on VAT revenue, at 11.8 percent of total tax revenue. This is partially because Switzerland has the lowest VAT rate of all countries covered, at only 7.7 percent, compared to an average of 21.3 percent. Italy (14.8 percent) and Belgium (15.4 percent) followed.
Note: This is part of a map series in which we examine tax revenue sources in Europe.
Source: Tax Policy – Reliance on Consumption Taxes in Europe
 Upstate Tax Professionals