Tax Policy – Cross-Border Corporate Effective Average Tax Rates in Europe
In today’s globalized economy, many businesses make foreign investments in countries around the world. Taxes—among many other factors—play a role in business decisions on whether and where such investments are made. Today’s maps look at the cross-border corporate effective average tax rates (EATR) on investment among 32 European countries.
Cross-border EATRs capture both domestic and foreign taxes. For example, imagine a Swedish company opens a foreign subsidiary in the UK. That foreign subsidiary is—like any other UK business—subject to corporate income tax in the UK. So the foreign subsidiary’s tax liability will first and foremost depend on how high the UK corporate tax rate is and how tax base provisions such as capital allowances are structured in the UK.
But—and that’s where the cross-border component comes in—because the subsidiary’s parent company is located in Sweden, it can, depending on Swedish international tax rules, be subject to additional taxes in Sweden. This can lead to a situation where a foreign subsidiary and a domestic business—both operating in the same country—face different effective tax rates.
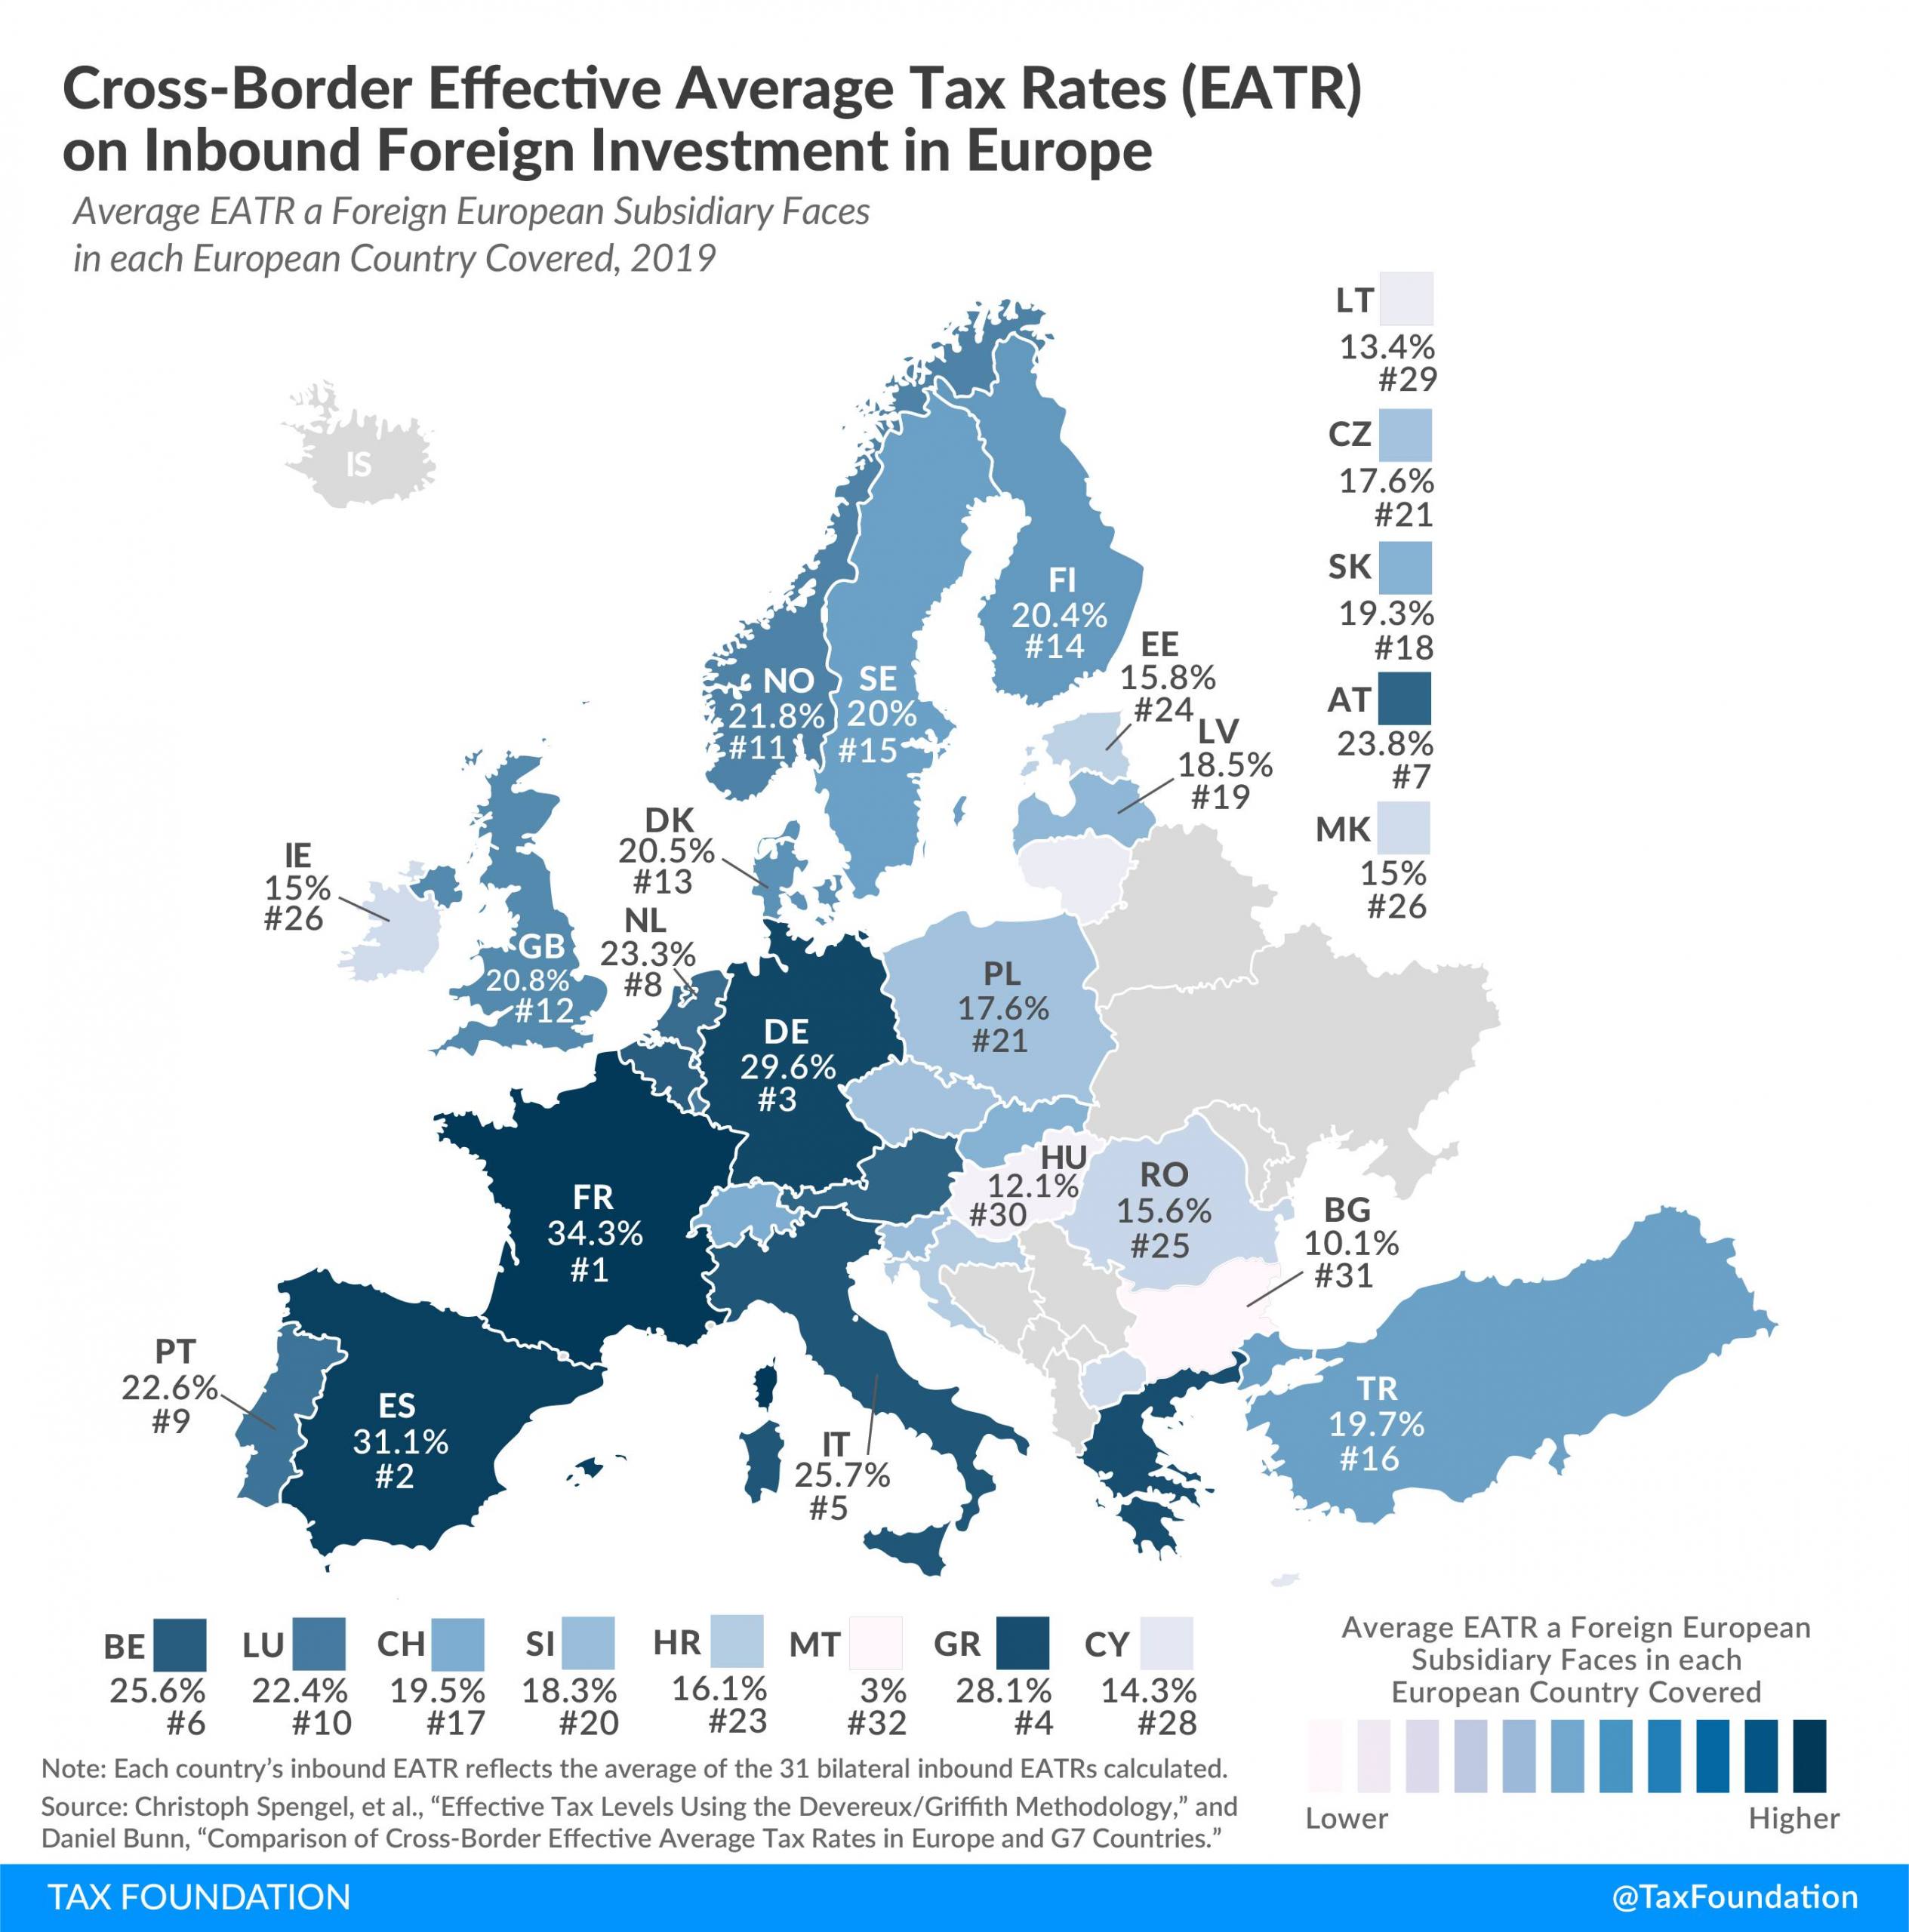
The following map shows average inbound EATRs for 32 European countries, which represent the average of the 31 bilateral cross-border EATRs calculated for each country for the year 2019. Going back to our example, it means that the UK inbound EATR reflects the average effective tax rate European subsidiaries face in the UK.
France levied, on average, the highest EATR on European subsidiaries operating in France, at a rate of 34.3 percent. Spain and Germany followed, at 31.1 percent and 29.6 percent, respectively.
Malta, in contrast, levied the lowest EATR on European subsidiaries in 2019, at only 3 percent. Bulgaria and Hungary had the second and third lowest inbound EATRs, at 10.1 percent and 12.1 percent.

Comparing these inbound EATRs with their corresponding domestic EATRs (see table below), one can see that almost all differences are very small. This reflects the fact that European countries generally operate territorial tax systems—which do not levy domestic taxes on foreign earnings—and that most European countries have tax treaties with each other. This means that—for the most part—income gets taxed where it is earned (at the foreign subsidiary), rather than where the parent company is located.
For example, the UK’s domestic EATR was 20.2 percent in 2019, which is only 0.6 percentage points lower than its inbound EATR. That means that European subsidiaries operating in the UK on average pay a similar effective tax rate as domestic UK businesses.
Our second map looks at outbound EATRs, the average tax rate a domestic business faces when investing in another European country covered. Because of the territorial nature of most countries’ tax systems and the broad tax treaty networks, these outbound EATRs to a certain degree simply reflect the average of European countries’ domestic EATRs.

| Domestic | Cross-Border | ||
|---|---|---|---|
| Inbound | Outbound | ||
| Austria (AT) | 23.1% | 23.8% | 18.4% |
| Belgium (BE) | 24.9% | 25.6% | 18.5% |
| Bulgaria (BG) | 9.0% | 10.1% | 19.2% |
| Croatia (HR) | 14.8% | 16.1% | 19.0% |
| Cyprus (CY) | 13.4% | 14.3% | 16.8% |
| Czech Republic (CZ) | 16.7% | 17.6% | 20.5% |
| Denmark (DK) | 19.8% | 20.5% | 18.9% |
| Estonia (EE) | 13.9% | 15.8% | 20.5% |
| Finland (FI) | 19.6% | 20.4% | 18.7% |
| France (FR) | 33.4% | 34.3% | 18.4% |
| Germany (DE) | 28.9% | 29.6% | 20.1% |
| Greece (GR) | 26.6% | 28.1% | 21.4% |
| Hungary (HU) | 11.1% | 12.1% | 19.2% |
| Ireland (IE) | 14.1% | 15.0% | 20.0% |
| Italy (IT) | 24.6% | 25.7% | 20.9% |
| Latvia (LV) | 16.7% | 18.5% | 29.4% |
| Lithuania (LT) | 12.7% | 13.4% | 18.9% |
| Luxembourg (LU) | 21.8% | 22.4% | 20.9% |
| Macedonia (MK) | 9.7% | 15.0% | 22.1% |
| Malta (MT) | 25.3% | 3.0% | 17.1% |
| Netherlands (NL) | 22.5% | 23.3% | 18.6% |
| Norway (NO) | 20.8% | 21.8% | 19.5% |
| Poland (PL) | 16.6% | 17.6% | 18.0% |
| Portugal (PT) | 21.4% | 22.6% | 16.4% |
| Romania (RO) | 14.7% | 15.6% | 20.5% |
| Slovak Republic (SK) | 18.7% | 19.3% | 20.4% |
| Slovenia (SI) | 17.3% | 18.3% | 19.5% |
| Spain (ES) | 30.1% | 31.1% | 19.2% |
| Sweden (SE) | 19.4% | 20.0% | 18.8% |
| Switzerland (CH) | 18.6% | 19.5% | 18.7% |
| Turkey (TR) | 12.7% | 19.7% | 23.2% |
| United Kingdom (GB) | 20.2% | 20.8% | 18.8% |
|
Note: Each country’s inbound (outbound) EATR reflects the average of the 31 bilateral inbound (outbound) EATRs calculated. Source: Christoph Spengel, et al., “Effective Tax Levels Using the Devereux/Griffith Methodology,” European Commission, November 2019, https://ec.europa.eu/taxation_customs/sites/taxation/files/final_report_2019_effective_tax_levels_revised_en.pdf, and Daniel Bunn, “Comparison of Cross-Border Effective Average Tax Rates in Europe and G7 Countries,” Tax Foundation, Mar. 12, 2020, https://taxfoundation.org/cross-border-effective-average-tax-rates-europe-g7-countries/. |
|||
Source: Tax Policy – Cross-Border Corporate Effective Average Tax Rates in Europe
 Upstate Tax Professionals