Tax Policy – How Well-Funded Are Pension Plans in Your State?
The most recent data from The Pew Charitable Trusts, released in July of 2019, shows the strain on state retirement systems nationwide as state pension funds strive to keep pace with benefits owed to public employees. While we highlighted this information soon after it was first released, it is worth revisiting in light of the coronavirus-related funding issues that states are facing.
Fiscal year 2017 (the most recent data available) saw a combined $1.28 trillion in state pension plan funding deficits. While massive, this was actually a decrease from Fiscal Year 2016’s $1.35 trillion gap. Pew attributes this improvement to strong returns on investment from higher-risk plans that helped some states to narrow their funding gaps since our previous coverage of this issue. However, those returns were modest and the result of a strong stock market, something states cannot currently count on.
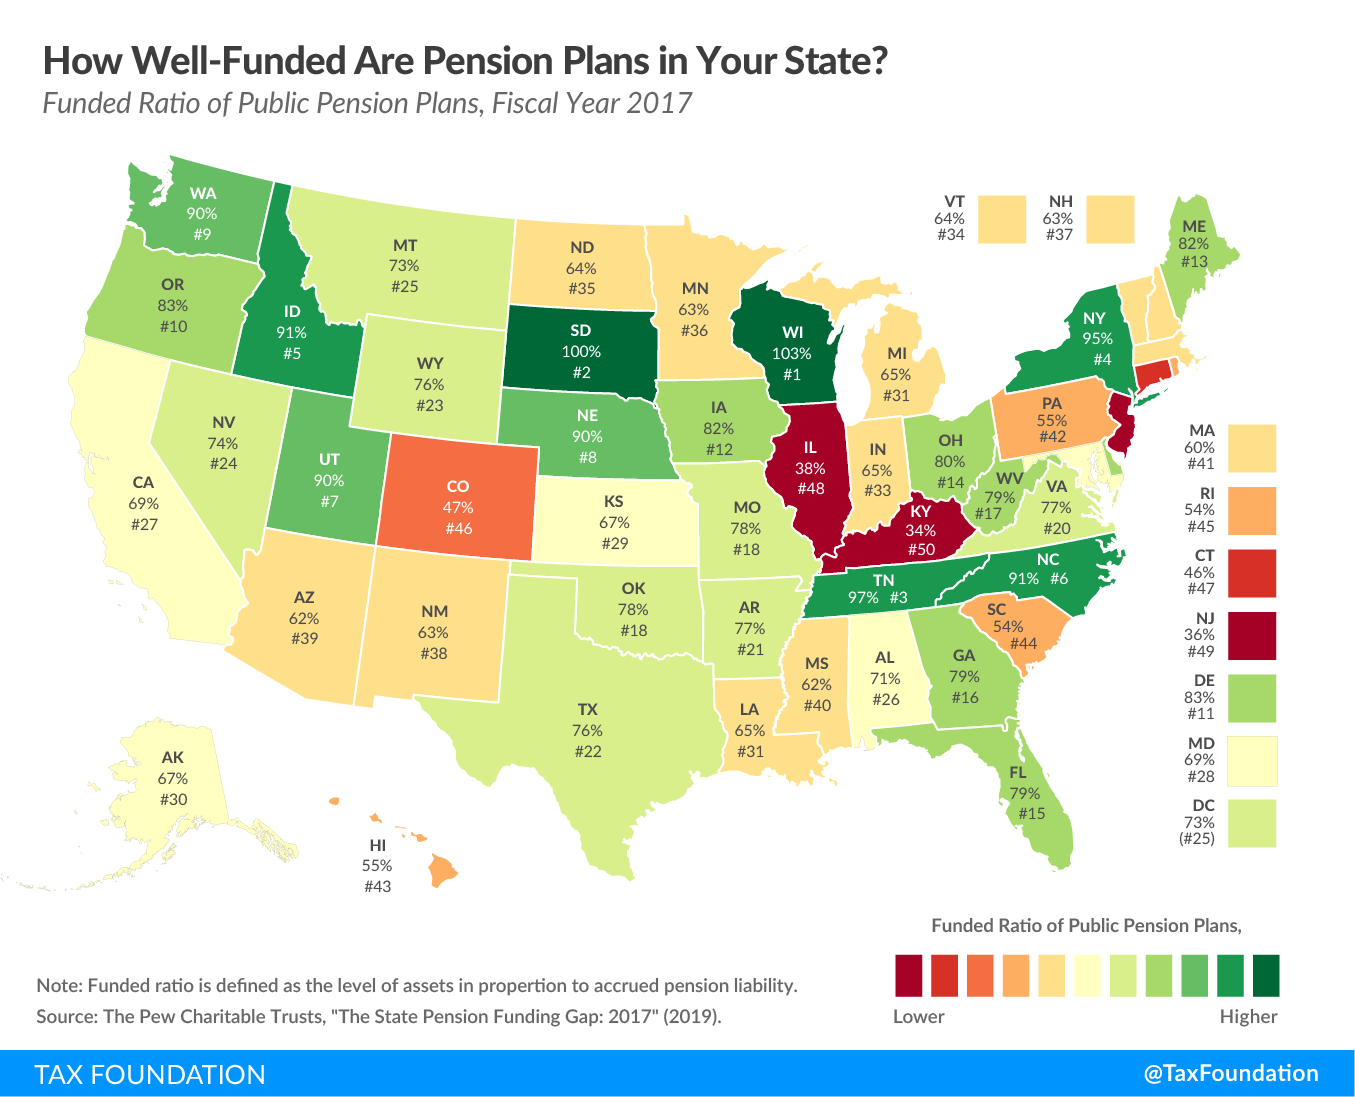
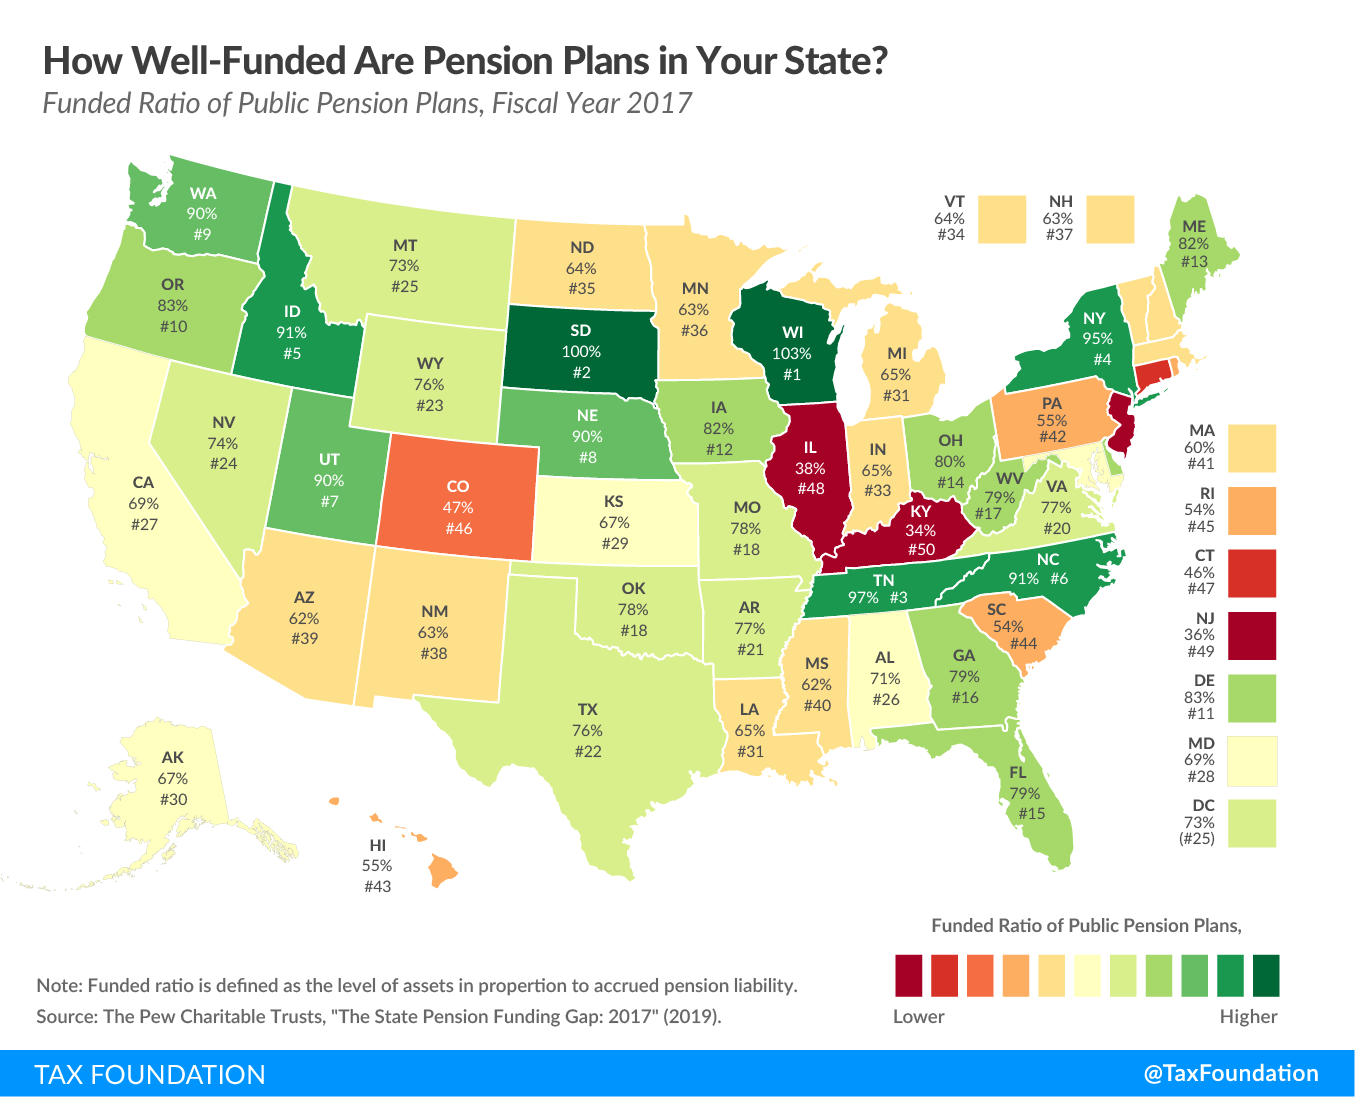
The map below uses FY 2017 data to show the funded ratio of public pension plans by state, calculated by measuring the market value of state pension plan assets in proportion to each state’s accrued pension liabilities. Lower funded ratios indicate when a state’s pension plan is not adequately funded, while higher funded ratios are evident in states where pension assets are keeping relatively good pace with accrued liabilities. Low funding levels are challenging not only because of the large contributions required to make up the debt, but also because they generate less in investment earnings.
As of 2017, Kentucky faced the largest deficit, with its plans only 34 percent funded. New Jersey followed at 36 percent funded, with Illinois only slightly better at 38 percent. According to Pew, these three states each increased their pension contributions in 2017—enough to slightly improve their funding ratios, but not enough to keep their debts from increasing.
Pension plans in Wisconsin and South Dakota were in the best shape that year, with funded ratios of 103 and 100 percent, respectively. Tennessee was right behind with a 97 percent ratio.
Twenty states saw pension plans that were less than two-thirds funded, and five states had pension plans that were less than 50 percent funded.
Pension plan structures vary from state to state, but historically, most states have provided some form of defined benefit plan that promises retirees a lifetime annuity. In recent years, some states have transitioned to a defined contribution plan for new employees, with employees controlling their own accounts and employer contributions funded by the state. Other states have shifted to a hybrid plan that combines elements of a defined benefit and a defined contribution plan. The shift from defined benefit plans toward more fiscally responsible alternatives can help states better manage future liability, but many states still face years of underfunded obligations that will need to be fulfilled.
The current crisis highlights the cost of underfunding pensions in years of economic growth. Replenishing these funds will be extremely challenging now, as state revenues decline; states that failed to use more than a decade of economic growth to shore up their funds will be in particularly poor shape now.
Source: Tax Policy – How Well-Funded Are Pension Plans in Your State?


