Tax Policy – Top Individual Income Tax Rates in Europe
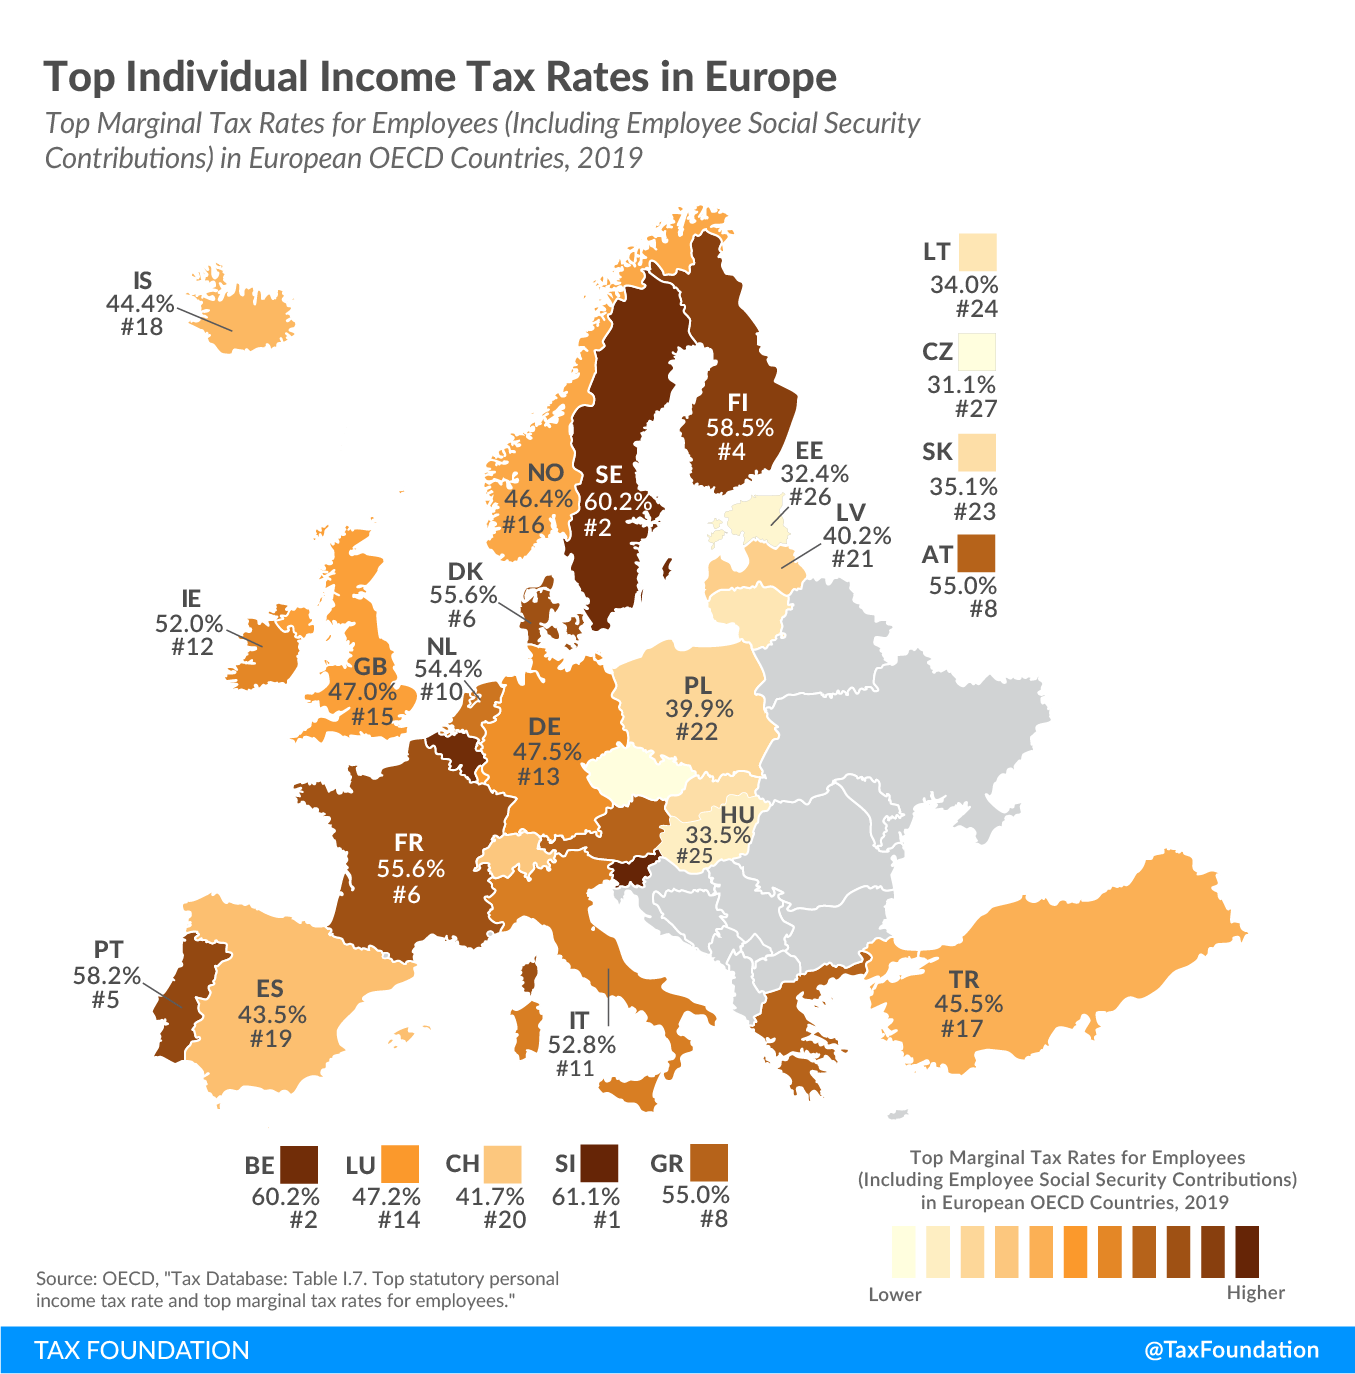
Most countries’ individual income taxes have a progressive structure, meaning that the tax rate paid by individuals increases as they earn higher wages. The highest tax rate individuals pay differs significantly across European OECD countries—as shown in today’s map.
The top individual income tax rate applies to the share of income that falls into the highest tax bracket. For instance, if a country has five tax brackets, and the top income tax rate of 50 percent has a threshold of €1 million, each additional euro of income over €1 million would be taxed at 50 percent.
The map reflects the marginal tax rate a single person without dependents faces at the earnings level at which the top statutory personal income tax rate first applies—in our example at the €1 million threshold. The marginal tax rate also includes employee-side social security contributions—in the U.S. commonly referred to as payroll taxes—and takes into account tax deductions and credits. In other words, it shows what share of that first euro over the top threshold earned in wages is paid in taxes.

Slovenia (61.1 percent), Belgium (60.2 percent), and Sweden (60.2 percent) had the highest top marginal income tax rates among European OECD countries in 2019. The Czech Republic (31.1 percent), Estonia (32.4 percent), and Hungary (33.5 percent) had the lowest rates.
The income level at which the statutory personal income tax rates apply—and at which the marginal rate shown in the map is measured—also varies significantly across the countries covered. Expressed as a multiple of a country’s average wage, the threshold ranges from 0 in Hungary to 22.7 in Austria. Hungary applies its flat 15 percent statutory personal income tax on all income earned. In contrast, Austria’s top statutory rate of 55 percent only applies to income above €1 million.
| Country | Top Marginal Income Tax Rate (Including Employee Social Security Contributions) | Top Statutory Personal Income Tax Rate | Threshold of the Top Statutory Personal Income Tax Rate | |||
|---|---|---|---|---|---|---|
| As a Multiple of the Average Wage | In National Currency* | In Euros* | In USD (PPP)* | |||
| Austria (AT) | 55.0% | 55.0% | 22.7 | EUR 1,096,663 | € 1,096,663 | $1,431,738 |
| Belgium (BE) | 60.2% | 52.9% | 1.1 | EUR 52,100 | € 52,100 | $67,804 |
| Czech Republic (CZ) | 31.1% | 15.0% | 0.3 | CZK 123,768 | € 4,821 | $9,850 |
| Denmark (DK) | 55.6% | 55.9% | 1.3 | DKK 558,044 | € 74,744 | $82,716 |
| Estonia (EE) | 32.4% | 20.0% | 0.8 | EUR 14,400 | € 14,400 | $26,172 |
| Finland (FI) | 58.5% | 51.1% | 1.9 | EUR 85,191 | € 85,191 | $99,012 |
| France (FR) | 55.6% | 55.4% | 16.1 | EUR 587,145 | € 587,145 | $778,601 |
| Germany (DE) | 47.5% | 47.5% | 5.3 | EUR 277,063 | € 277,063 | $373,533 |
| Greece (GR) | 55.0% | 55.0% | 11.0 | EUR 234,326 | € 234,326 | $417,388 |
| Hungary (HU) | 33.5% | 15.0% | 0.0 | HUF 0 | € 0 | $0 |
| Iceland (IS) | 44.4% | 46.2% | 1.2 | ISK 11,588,590 | € 84,416 | $82,389 |
| Ireland (IE) | 52.0% | 48.0% | 1.4 | EUR 70,044 | € 70,044 | $89,597 |
| Italy (IT) | 52.8% | 47.2% | 2.6 | EUR 83,263 | € 83,263 | $123,420 |
| Latvia (LV) | 40.2% | 31.4% | 4.8 | EUR 62,801 | € 62,801 | $126,554 |
| Lithuania (LT) | 34.0% | 27.0% | 9.5 | EUR 136,344 | € 136,344 | $300,694 |
| Luxembourg (LU) | 47.2% | 45.8% | 3.5 | EUR 214,756 | € 214,756 | $251,267 |
| Netherlands (NL) | 54.4% | 51.8% | 1.4 | EUR 71,886 | € 71,886 | $91,237 |
| Norway (NO) | 46.4% | 38.2% | 1.6 | NOK 964,800 | € 97,938 | $100,552 |
| Poland (PL) | 39.9% | 32.0% | 1.7 | PLN 101,147 | € 23,536 | $57,010 |
| Portugal (PT) | 58.2% | 53.0% | 15.0 | EUR 280,899 | € 280,899 | $488,964 |
| Slovakia (SK) | 35.1% | 25.0% | 3.2 | EUR 41,867 | € 41,867 | $82,234 |
| Slovenia (SI) | 61.1% | 50.0% | 4.6 | EUR 95,264 | € 95,264 | $165,883 |
| Spain (ES) | 43.5% | 43.5% | 2.4 | EUR 65,102 | € 65,102 | $102,819 |
| Sweden (SE) | 60.2% | 57.2% | 1.5 | SEK 702,925 | € 66,382 | $78,821 |
| Switzerland (CH) | 41.7% | 41.7% | 3.3 | CHF 301,123 | € 270,697 | $260,607 |
| Turkey (TR) | 45.5% | 35.8% | 3.0 | TRY 174,119 | € 27,387 | $95,045 |
| United Kingdom (GB) | 47.0% | 45.0% | 3.7 | GBP 150,000 | € 170,888 | $217,673 |
|
Source: OECD, “Tax Database: Table I.7. Top statutory personal income tax rate and top marginal tax rates for employees,” April 2020, https://stats.oecd.org/index.aspx?DataSetCode=TABLE_I7. Note: *These thresholds have been calculated by multiplying the threshold expressed as a multiple of the average wage with the average wage expressed in the national currency and in US$ Purchasing Power Parity (PPP). Thus, they are approximations of the statutory thresholds. For non-Euro countries, the threshold was converted into euros using the average 2019 exchange rates provided by the European Central Bank (ECB). |
||||||
Source: Tax Policy – Top Individual Income Tax Rates in Europe
 Upstate Tax Professionals